How to Use Grafana to Monitor JMeter Non-GUI Results - Part 2
In this article, you'll learn a few easy ways to monitor your JMeter results using Grafana, an open-source analytics and monitoring tool.
Join the DZone community and get the full member experience.
Join For FreeIn our latest article about JMeter Non-GUI Monitoring, we explained how to integrate Apache JMeter™ with Grafana to establish real-time monitoring of performance scripts. This can be done by using a local installation of the InfluxDB database as a metrics storage, together with a Backend Listener and the “GraphiteBackendListenerClient” implementation.
This Grafana integration via “GraphiteBackendListenerClient” requires developers to proceed with a list of non-trivial steps, to get it done. But our followers noticed (special thanks to Vincent D.) that there is one more easy way to perform an additional JMeter Grafana integration, which is simplified and doesn’t require any additional configuration of the InfluxDB.
We always appreciate the feedback, so in this blog post we will explain a simpler way that uses the same JMeter Backend Listener, but with the “InfluxDbBackendListenerClient” implementation which takes less effort to setup.
This implementation uses an API for pushing metrics. With the release of JMeter 3.2 by the Apache team, a new Backend Listener interface was introduced. This listener enables the use of the InfluxDB HTTP API and pushing metrics directly to the database via Asynchronous HTTP calls, without any additional database configurations.
Step-by-Step Implementation of the InfluxDbBackendListenerClient
1. Install Grafana and InfluxDB
If you took a hands-on approach to our latest article about Grafana monitoring, you probably already have Grafana and InfluxDB installed on your local machine. If not, use the InfluxDB and Grafana installation guides to install both locally. The same goes for our performance script monitoring which will be exactly the same as we created in the last article. But actually, you can use any performance script that you already have ready in your arsenal.
2. How to Use InfluxDB’s HTTP API
In the last article, we showed an example of how to use the InfluxDB command line interface to make database queries. Another way to interact with the database is with InfluxDB’s HTTP API, which allows you to query and write data metrics from/to the database.
By default, InfluxDB exposes its HTTP API on the 8086 port. To check if it works for you, let’s ping that endpoint with an HTTP client like CURL (you can use any another HTTP client as well). With curl you can use the curl -i localhost:8086/ping command to send an HTTP GET request to the InfluxDB API endpoint, where the -i option prints the request output to the console:
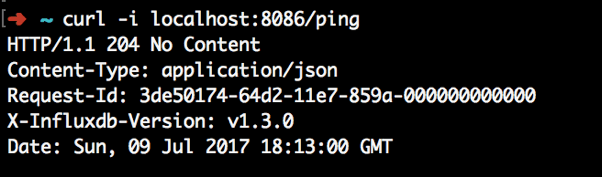
If your InfluxDB instance is up and running, you should see a similar response from your ping request. With the InfluxDB HTTP API, you can perform exactly the same operations that you can perform with the command line interface. Let’s create a database for our metrics and call it “blazedemo_performance,” by using the specified command: curl -i -XPOST http://localhost:8086/query --data-urlencode "q=CREATE DATABASE blazedemo_performance.
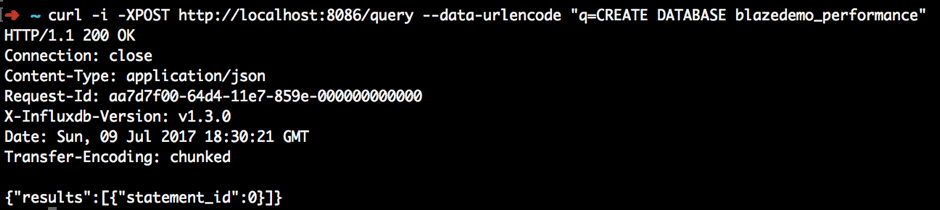
As you can see, it is quite simple. That’s why the Apache team thought, why not use the same HTTP API to push metrics from JMeter to InfluxDB? With the launch of JMeter 3.2, they introduced a new implementation of Backend Listener, which is called “InfluxdbBackendListenerClient.” It was added to JMeter 3.2 in Alpha state (an early version that might be unstable). But it turns out it is quite stable and is already used across the JMeter community without any critical issues.
3. Configure the JMeter Backend Listener
Once you have a performance script, all you need to do is to add the Backend Listener with the “org.apache.jmeter.visualizers.backend.influxdb.InfluxdbBackendListenerClient” value as a “Backend Listener implementation” config value (don’t panic, this value is specified in the List box and you don’t need to type it yourself). Add a few more specific configs:
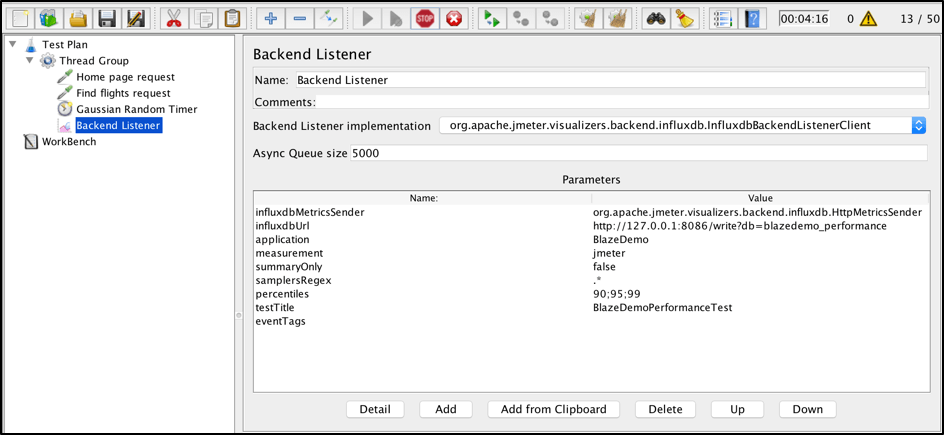
- influxdbMetricsSender - the implementation class for sending metrics to InfluxDB. Currently, there is only one available option, so keep it as default.
- influxdbUrl - the URL of InfluxDB is in the following format: http://[influxdb_host]:[influxdb_port]/write?db=[database_name]. As we have created the “blazedemo_performance” database and we are running it on a local machine with a default port, then, in our case, the URL will be http://127.0.0.1:8086/write?db=blazedemo_performance.
- application - we can store metrics from different applications under one database. That’s why this param is used for grouping metrics from one specific app.
- measurement - the name of the measurement that will be stored in InfluxDB (text-based line InfluxDB internal protocol to store metrics). Use default ‘jmeter’ for that property.
- summaryOnly - put ‘true’ if you want to keep summary results only in the database and do not want to collect all the detailed metrics during test execution.
- samplersRegexp - use the regexp expression to filter specific metrics which you want to store in a database. Use the default “.*” value if you want to store all your metrics.
- percentiles - metrics percentiles that should be sent to the database.
- eventTags - a list of tags which will be stored in the ‘events’ measurement of InfluxDB.
4. Run Your Performance Script
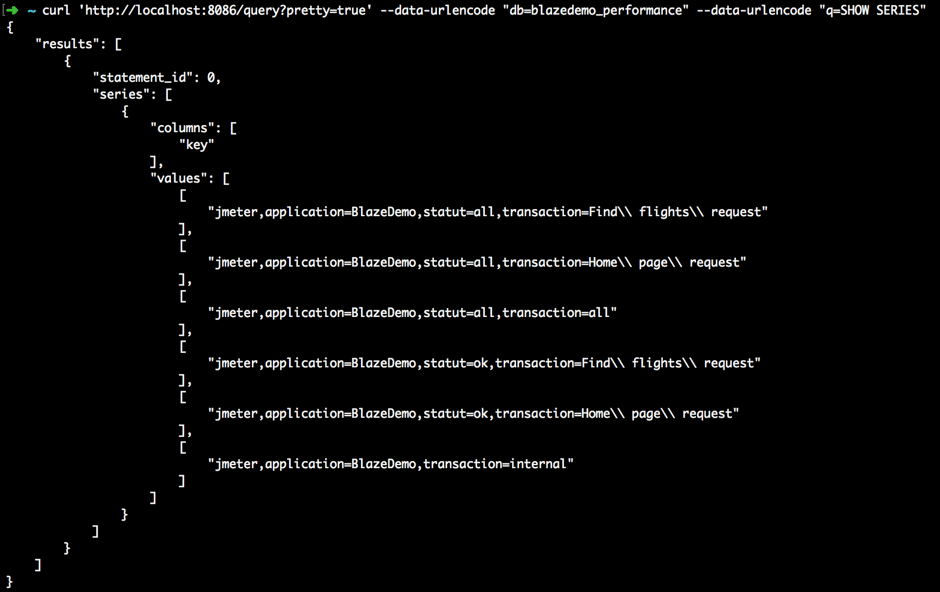
Once the configuration is in place, let’s run our JMeter performance script. You can run it via the JMeter UI or you can run it in the Non-GUI mode (check this article if you want to know how). As soon as we start our performance script, the Backend Listener starts to push metrics which will be collected in InfluxDB database with the name “blazedemo_performance” as we configured before.
After we start our script, we need to confirm that metrics are being collected. For that, we can use HTTP API and this curl request: curl 'http://localhost:8086/query?pretty=true' --data-urlencode "db=blazedemo_performance" --data-urlencode "q=SHOW SERIES where the query ?pretty=true is used to show returns of the JSON response in this structured way:
5. Configure Grafana and Create Dashboards
Once we’ve confirmed the metrics are there, we can continue with the Grafana configuration. As we installed Grafana before, it should be up and available on http://localhost:3000, where you can use ‘admin’ as a default username and password to log in. If you remember from the last article, first of all, you need to configure the data source. Even if you have done that step previously, this time we are using another database and therefore we need to add one additional data source, which is mapped to the newly created database. To add the new data source in Grafana go to:
Menu -> Data Sources -> Add data source
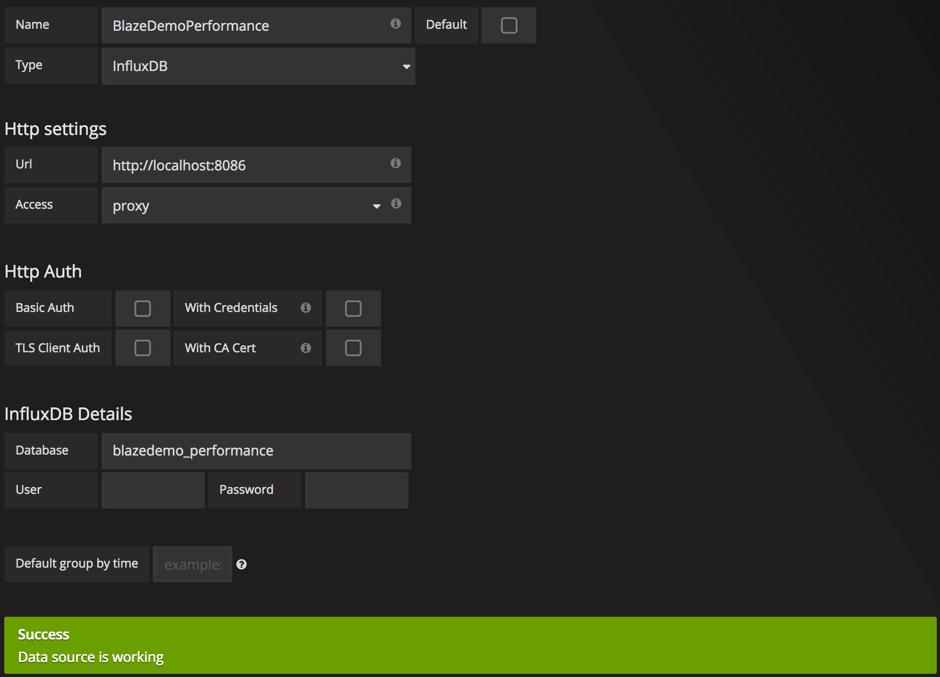
If the data source was added successfully, you can start the dashboard's creation:
Menu -> Dashboards -> New
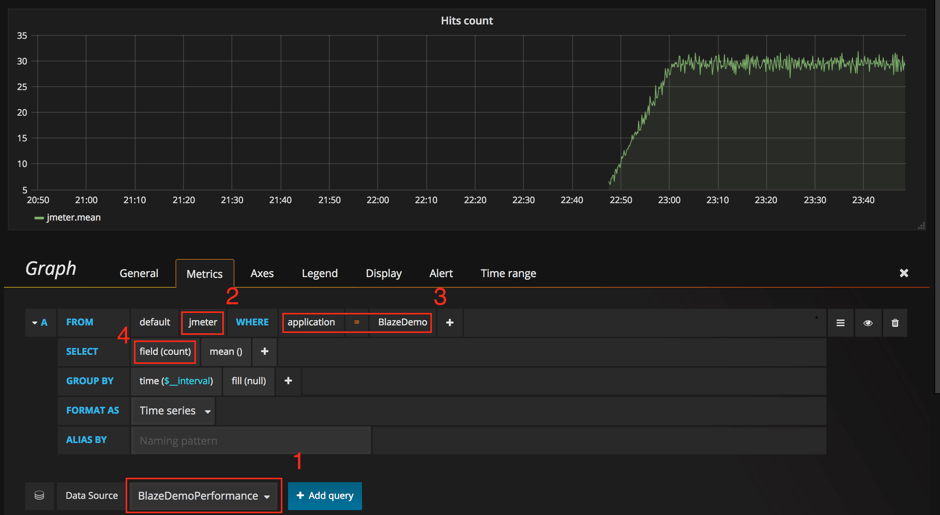
During dashboard creation, you first need to choose the correct ‘Data Source,’ based on the one that you have just added. On the second and third steps, you need to specify measurement and application names, based on values that we have specified into the JMeter Backend Listener. On the last step, you need to choose metrics that will be shown on the graph. It’s very simple, as it should be!
As you can see, the “InfluxdbBackendListener” is much simpler and requires less configuration to start using Grafana for JMeter tests monitoring. In comparison with the “GraphiteBackendListener” which we introduced in the last article, this way is much much simpler. But is it simple enough, or are there even simpler ways? You will be surprised, but YES!
Out-of-the-Box JMeter Grafana Dashboard
Developers from NovaTec-APM decided to make our lives much easier and created their own ready-to-use JMeter Grafana dashboard with all the key monitoring graphs and dashboard elements. You can find all the relevant information through this link. Using that predefined dashboard you don’t need to spend time on dashboard creation, as everything is already created for you to monitor detailed stats right away in just a few easy steps.
For this example, we need to create a separate database for metrics storage: curl -i -XPOST http://localhost:8086/query --data-urlencode "q=CREATE DATABASE blazedemo_load
First of all, you need to download a separate Backend Listener implementation, which is basically a jar file that you can download from this link. Once the jar file is downloaded, you need to place it under “/lib/ext” of your JMeter home folder:
> cp /Users/ybushnev/Downloads/JMeter-InfluxDB-Writer-plugin-1.2.jar /usr/local/Cellar/jmeter/3.2/libexec/lib/ext
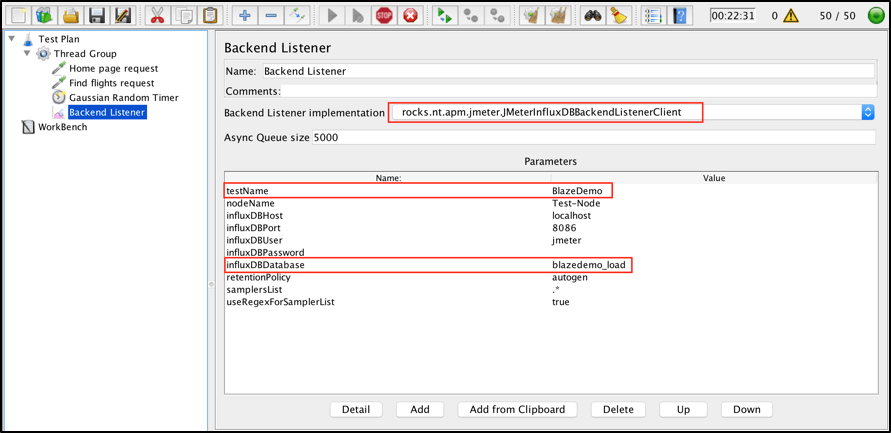
If your JMeter application is open, you need to restart to proceed with the installation of the additional plugin. After that, you can open the previously created “Backend Listener” and this time there will be an additional option available in the “Backend Listener Implementation” field: “rocks.nt.apm.jmeter.JMeterInfluxDBBackendListenerClient.” The configuration of this listener client is pretty similar to implementations that we have used before, and the configuration options are almost the same. In our case, all we need to do is to provide the “testName” and “influxDBDatabase” names, respectively.
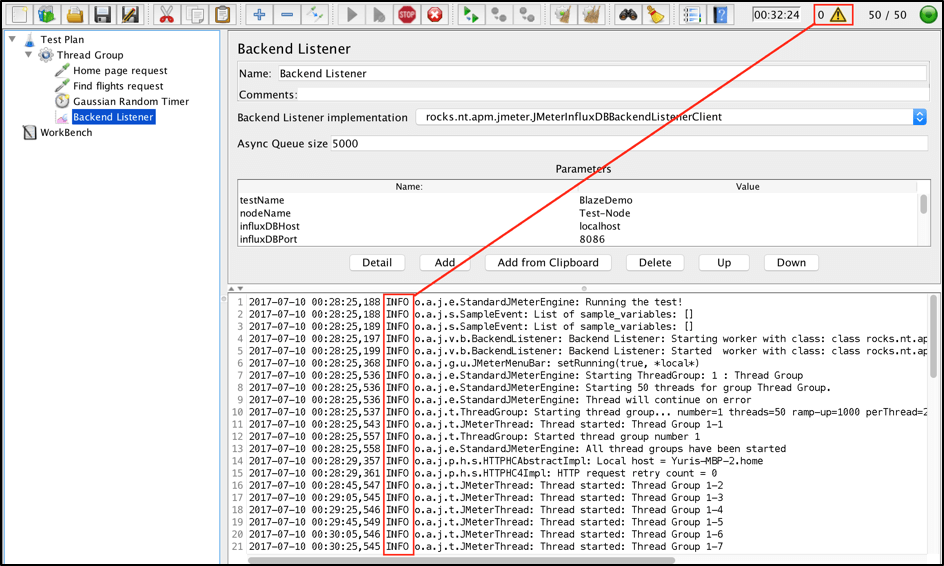
After the configuration is in place, you can run your performance script and confirm there are not any errors in the JMeter logs execution:
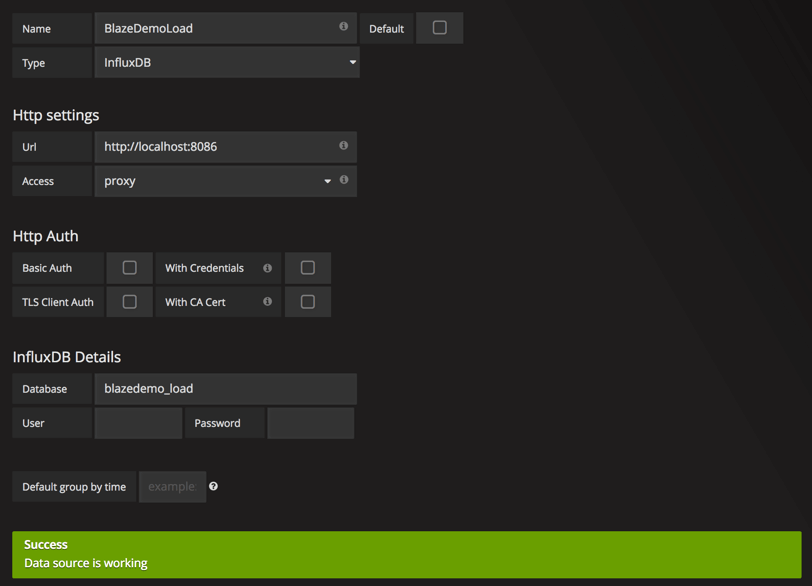
If you don’t see any errors, the metrics should be collected successfully and you can continue with the Grafana configuration. As we've done this before, we need to add the additional data source that will be mapped to “blazedemo_load” database:
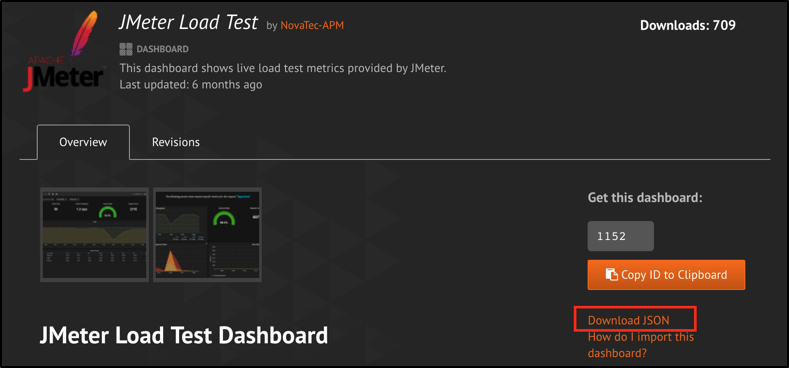
And now is the most awesome step. On the JMeter Load Test dashboard page, you can download the Grafana template in JSON format:
After that, open Grafana and instead of the new dashboard creation go to:
Menu -> Dashboards -> Import and choose “Download JSON,” specifying the data source that we have just created for that example:
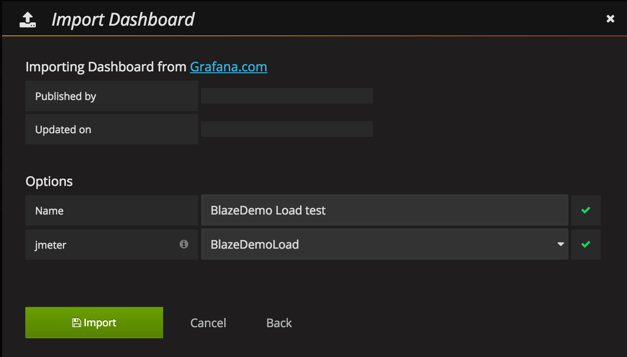
After that, by clicking on “Import” we will automatically create outstanding JMeter monitoring without any additional configuration:
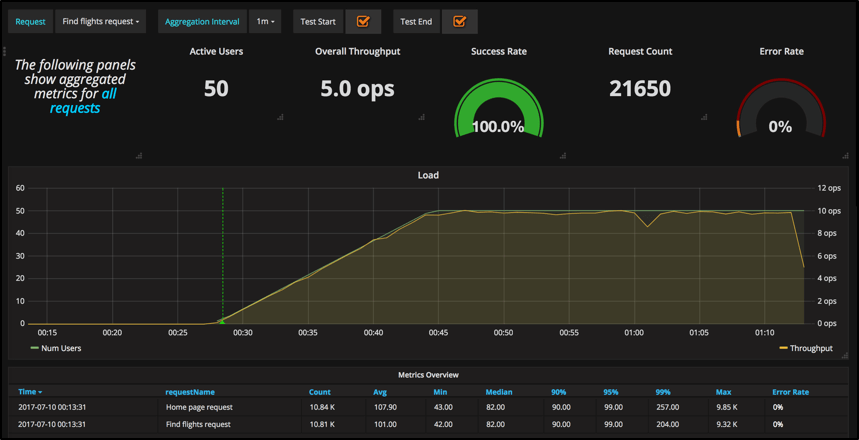
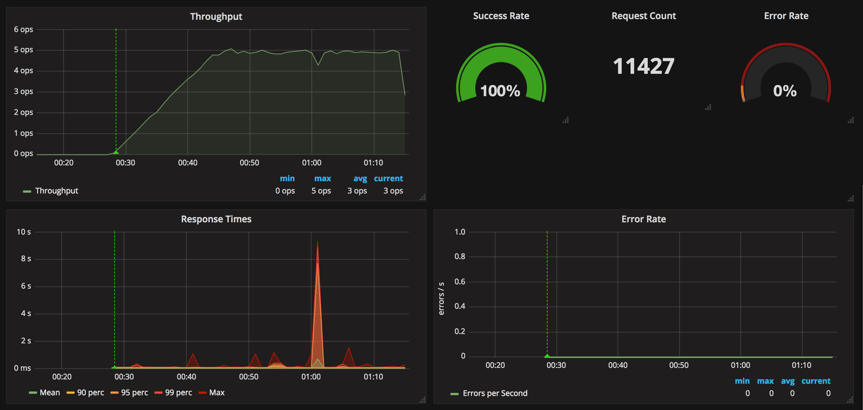
As you can see, there are always several ways to achieve your goals. Based on the 3 JMeter and Grafana integrations we have tried in this and the previous article, I would definitely recommend that you go with the “JMeterInfluxDBBackendListenerClient” integration option. Yes, it requires you to install an additional plugin, but it is nothing in comparison to the benefits that this plugin provides you in the end. Let us know which way you prefer and why in the comments section.
Published at DZone with permission of Yuri Bushnev. See the original article here.
Opinions expressed by DZone contributors are their own.
Comments