Essential JVM Tools for Garbage Collection Debugging
This article explores several tools for analyzing Java GC performance, including built-in utilities like jstat, jcmd, and jvisualvm.
Join the DZone community and get the full member experience.
Join For FreeJava garbage collection is a boon to programmers, but it can cause headaches in production. Poorly-tuned GC is extremely resource-hungry.
Tuning and troubleshooting GC is therefore an important skill. How do you obtain information on how GC is performing? What tools can you use to identify bottlenecks and inefficiencies?
This article takes a brief look at several different applications that analyze GC performance.
Understanding Java Garbage Collection
Before you begin monitoring and tuning GC, you’ll need a good understanding of the tasks it performs, the terminology, and the various GC algorithms. If you’re new to this topic, I’d recommend reading this comprehensive article on Java Garbage Collection.
GC Logging
The best source of information about GC is the logs, which record details of all garbage collection events. These include:
- What triggered the event;
- What type of event;
- Duration;
- Memory reclaimed in each memory pool.
To activate GC logging, use command line switches when invoking the JVM:
- For Java 8 and earlier:
-XX:+PrintGCDetails -Xloggc:<gc-log-file-path> - For Java 9 and later:
-Xlog:gc*:file=<gc-log-file-path>where<gc-log-file-path>is the path to the file that will contain the log.
The logs are in text format, and may look like this:
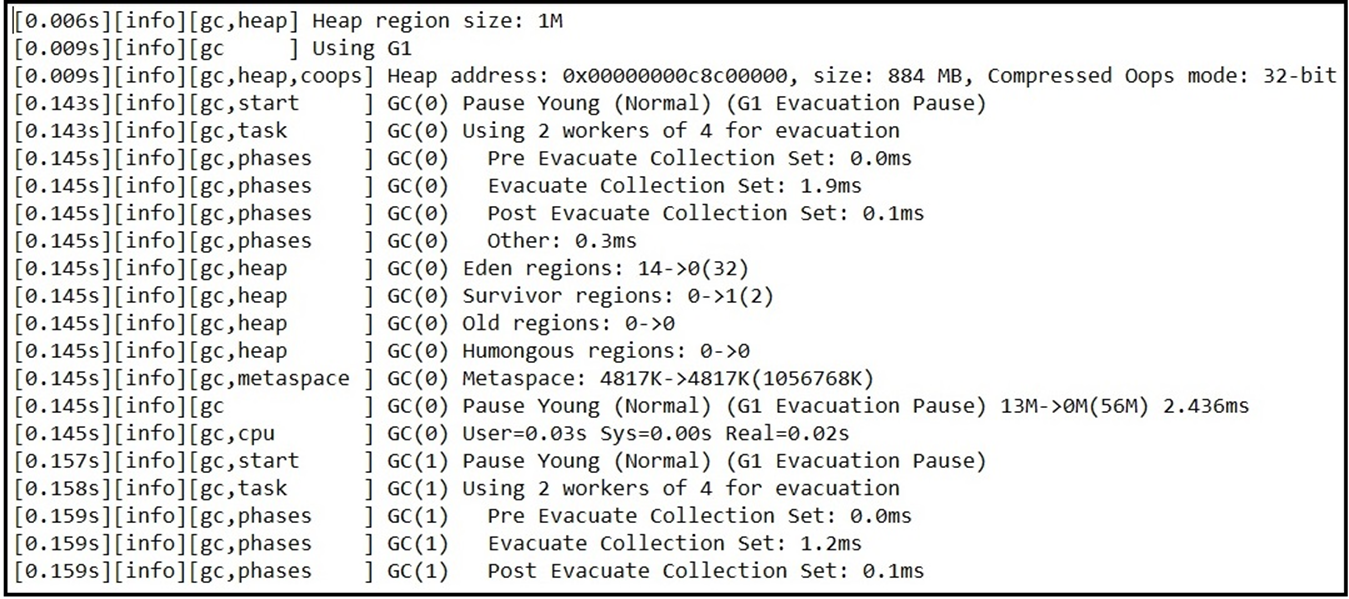
Fig 1: Sample GC Log File
The format may differ depending on the version of JVM and the algorithm selected. For information about the log file format, see: Analyzing GC Logs Guide.
We wouldn’t normally analyze the logs manually, since they may be thousands of lines long. They can be useful for a quick check, or for inputting into analysis tools.
JDK Utilities for Troubleshooting and Monitoring
The JDK includes several useful tools for collecting troubleshooting information.
jvisualvm
This is a GUI-based tool useful for monitoring various aspects of JVM performance. It captures information about running programs, useful for on-the-fly analysis.
To invoke the tool, type jvisualvm on the command line.
It displays a GUI screen, listing all running Java applications on the left. After choosing the application, you can find information about the process, and open a monitor screen as shown below.
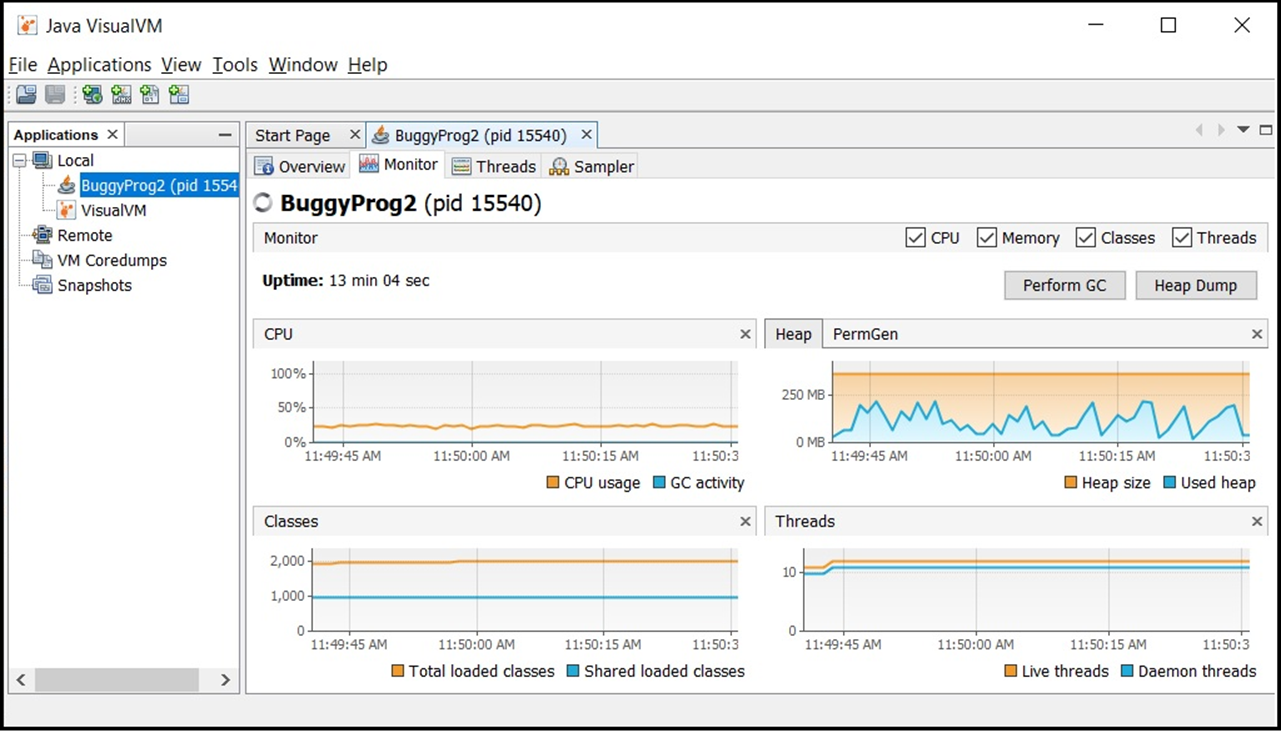
Fig 2: Monitoring Screen: jvisualvm
jvisualvm doesn’t specifically show GC statistics, but you can see from the heap graph whether GC is successfully clearing unused memory. The CPU usage graph is also useful. You can request the application to perform GC, letting you monitor resource usage during the event.
jstat
This is a multi-purpose tool, gathering runtime statistics about various aspects of Java applications. It has many options, some of which are useful for GC monitoring:
-
-gc: Detailed GC statistics; -
-gcutil: Percentage used in each memory pool, and a summary of GC activity; -
-gccapacity: The minimum, maximum and current sizes of each memory pool.
A sample jstat command is:
jstat -gcutil 15540 250 10 > jstatout.txt-
-gcutil: The option; -
15540: The PID of the Java process; -
250: The sampling interval in milliseconds; -
10: The number of samples; -
jstatout.txt: The output file.
The output, imported into a spreadsheet, looks like this:
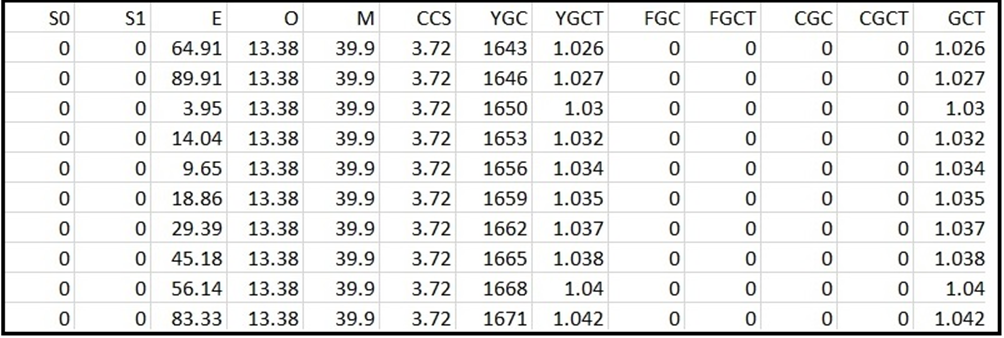
Fig 3: GC Statistics Produced by jstat
The output columns are defined in the jstat official documentation.
jcmd
This is a versatile troubleshooting utility, giving insights into JVM performance. It has many options. Particularly useful in monitoring GC is:
jcmd 6504 VM.events > events.txt6504: The PID of the Java application;VM.events: An option requesting JVM events;events.txt: The output file.
This includes details of all types of JVM events, so the output is quite long. Scrolling through the output, you’ll find GC information that looks like this:
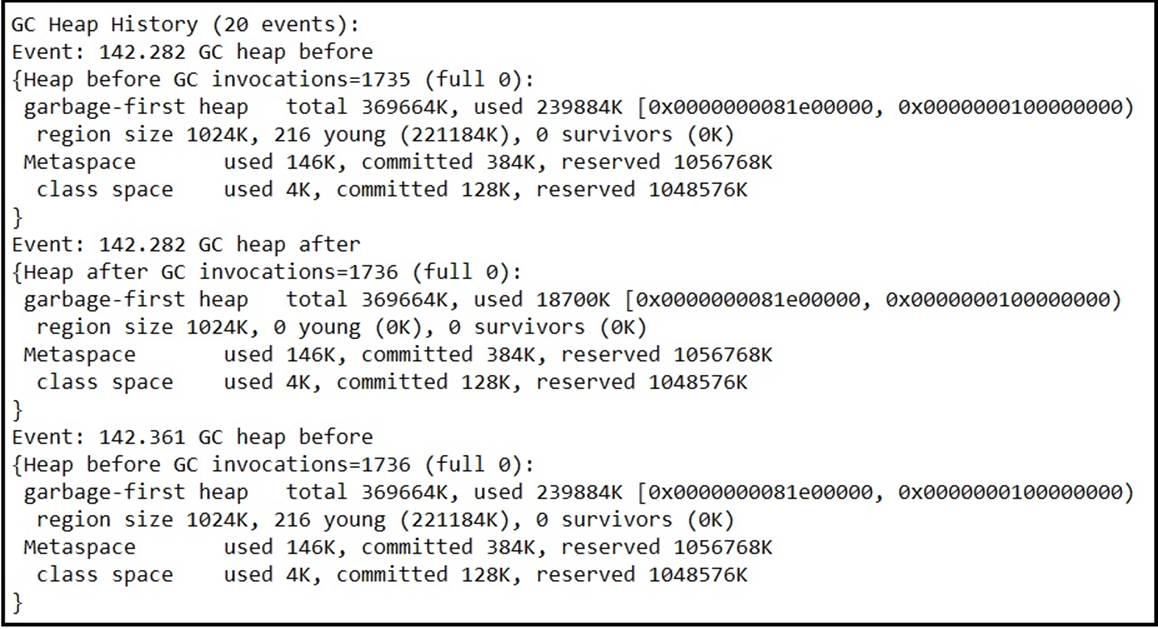
Fig 4: GC Events Section in jcmd Output
External Tools
Although all these tools provide useful information, getting a full picture of how well GC is working can still be tedious. Let’s look at two tools outside of the JDK that can streamline GC analysis.
IBM GC and Memory Visualizer (GCMV)
This is a comprehensive GC log analyzer. It’s good for advanced users, but difficult for beginners. You need to know exactly what you’re looking for. GCMV is a GUI-based tool, allowing you to select the metrics you want to see. It then displays them in graph form, as shown below.
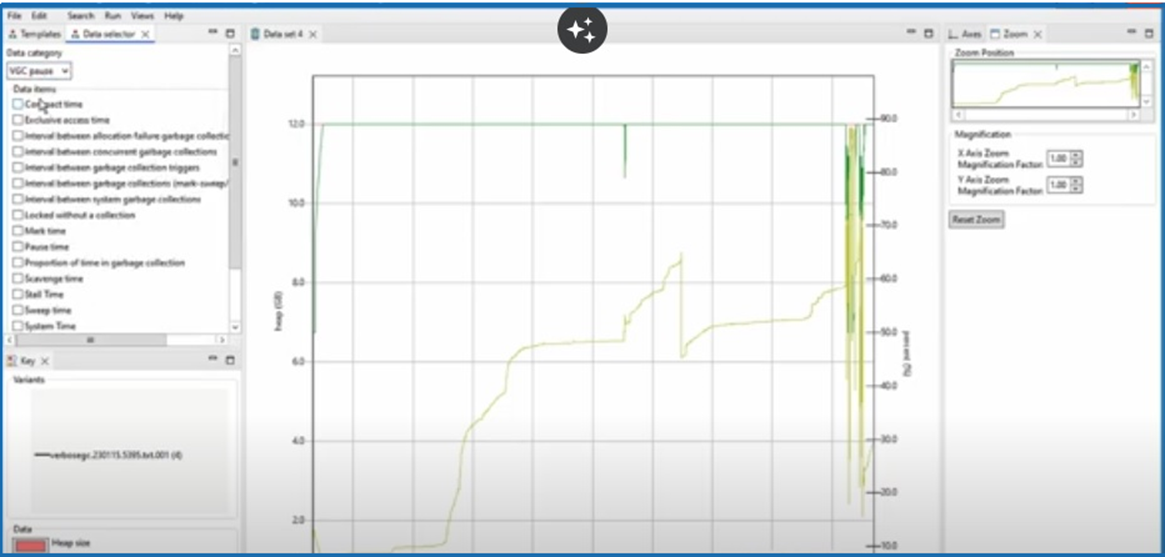
Fig 5: IBM GCMV
Since you have to manually select each set of metrics, it can be time-consuming to obtain a full picture of GC performance.
GCeasy
GCeasy is also a log analyzer. It provides users at any level with access to detailed GC analysis in a short amount of time.
GCeasy performs a detailed analysis of the log, and presents the results in a series of graphs and charts. It uses AI to create a report of any potential issues, as well as giving tailored performance tuning suggestions. The information includes key performance indicators, detailed memory analysis, and a graph of memory before and after each GC event. It’s ideal for regular GC monitoring, since it can be automated.
The image below shows a montage of a few of the charts produced by GCeasy.
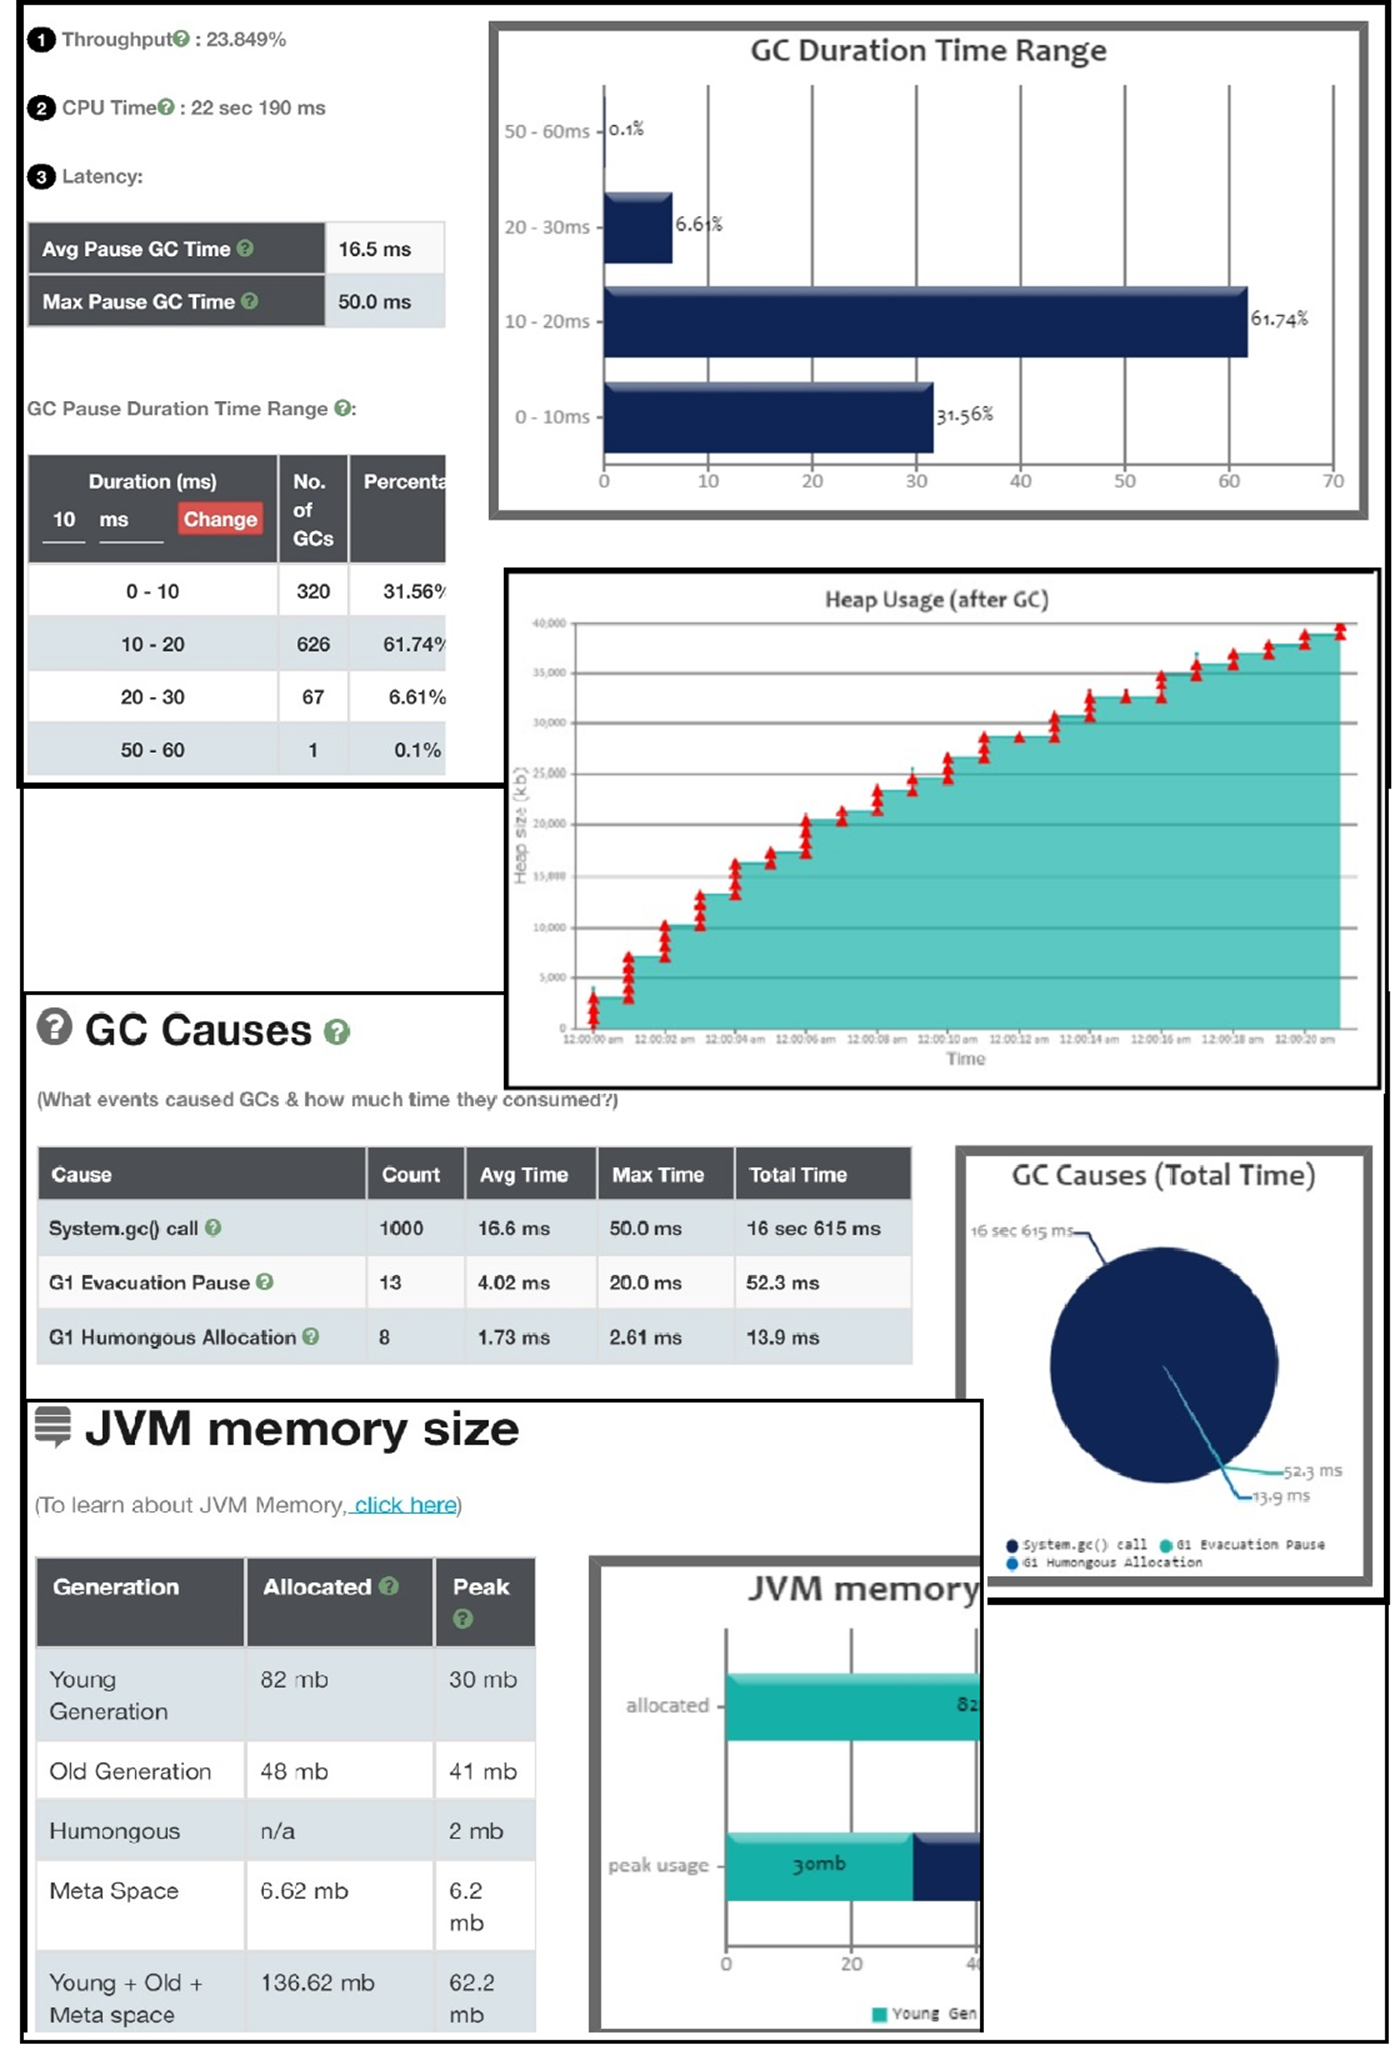
Fig 6: Selection of Charts Produced by GCeasy
Conclusion
In this article, we’ve looked at a few tools you can use to monitor Java garbage collection performance.
Each of these has its place, but for fast and comprehensive GC analysis, GCeasy is the tool of choice for many systems engineers. Its ease of use and quality information make garbage collection tuning simple.
Opinions expressed by DZone contributors are their own.
Comments