Monitor Service Uptime With Heartbeat and the ELK Stack
The newest official addition to the Beats family, Heartbeat, probes services to check if they are reachable or not. See how it works with the ELK stack.
Join the DZone community and get the full member experience.
Join For FreeIn previous posts, we took a look at Metricbeat, Winlogbeat, and Packetbeat. It’s now time to check out the newest official addition to the Beats family: Heartbeat.
Just in case you are not familiar with Beats, Beats is the name of a family of log shippers by Elastic, each designed for a different use case. Filebeat, for example, is built for tracking and logging specific files while Winlogbeat is designed for shipping Windows event logs.
Heartbeat (beta) was introduced in Elastic Stack 5.0 back in October and is meant for “uptime monitoring.” In essence, what Heartbeat does is probe services to check if they are reachable or not — it’s useful, for example, to verify that the service uptime complies with your SLA. All you need to do is supply Heartbeat with a list of URLs and uptime metrics to send to your stack, either directly to Elasticsearch or to Logstash for enrichment before indexing.
Let’s take a closer look.
Installing and Running Heartbeat
As with all the other members of the Beats family, installation is extremely simple. As opposed to the other Beats, though, Elastic recommends installing Heartbeat on a separate machine or even outside the network where the services that you are monitoring are running.
In this case, I’m using an Ubuntu 16.04, so my installation steps are as follows.
First, I’m going to download and install the Elasticsearch public signing key.
wget -qO - https://artifacts.elastic.co/GPG-KEY-elasticsearch | sudo apt-key add -On Debian distros, Elastic also recommends installing the apt-transport-https package:
sudo apt-get install apt-transport-httpsThen, I’m going to save the repository definition to /etc/apt/sources.list.d/elastic-5.x.list:
echo "deb https://artifacts.elastic.co/packages/5.x/apt stable main" | sudo tee -a /etc/apt/sources.list.d/elastic-5.x.listAnd last but not least:
sudo apt-get update && sudo apt-get install heartbeatIf you don’t want to use Apt, Heartbeat packages and instructions are detailed here.
Configuring and Running Heartbeat
If started with the default settings, Heartbeat is configured to ping a local instance of Elasticsearch and export metrics to the same local instance. To change these settings and fine tune Heartbeat for your needs, you will need to open the Heartbeat configuration file (located in Deb installations at: /etc/heartbeat/heartbeat.yml).
If you’ve used any of the other Beats, you will find yourself familiar with the structure of the file.
The most important section in the file is the Monitors section. A “monitor” tells Heartbeat which URL to monitor individually and what scheduling rule to use.
As a simple example, let’s add to the existing configuration our local instance of Kibana as a service that we want to monitor. The configuration would now look as follows:
heartbeat.monitors:
- type: http
  urls: ["http://localhost:9200"]
  schedule: '@every 10s'
  timeout: 16s
- type: http
  urls: ["http://localhost:5601"]
  schedule: '*/5 * * * * * *'
Scheduling is based on a cron-like syntax, and the monitor type can either be HTTP, TCP, or ICMP. Each of the monitors has a different use case — you will most likely use the ICMP type, for example, for a simple ping check of whether a service is available or not and the HTTP type to connect via HTTP.
The other sections in the configuration file are similar to the other Beats and include general logging and output options. Conveniently, a full configuration example that includes all the available options at etc/heartbeat/heartbeat.full.yml.
To run Heartbeat, use:
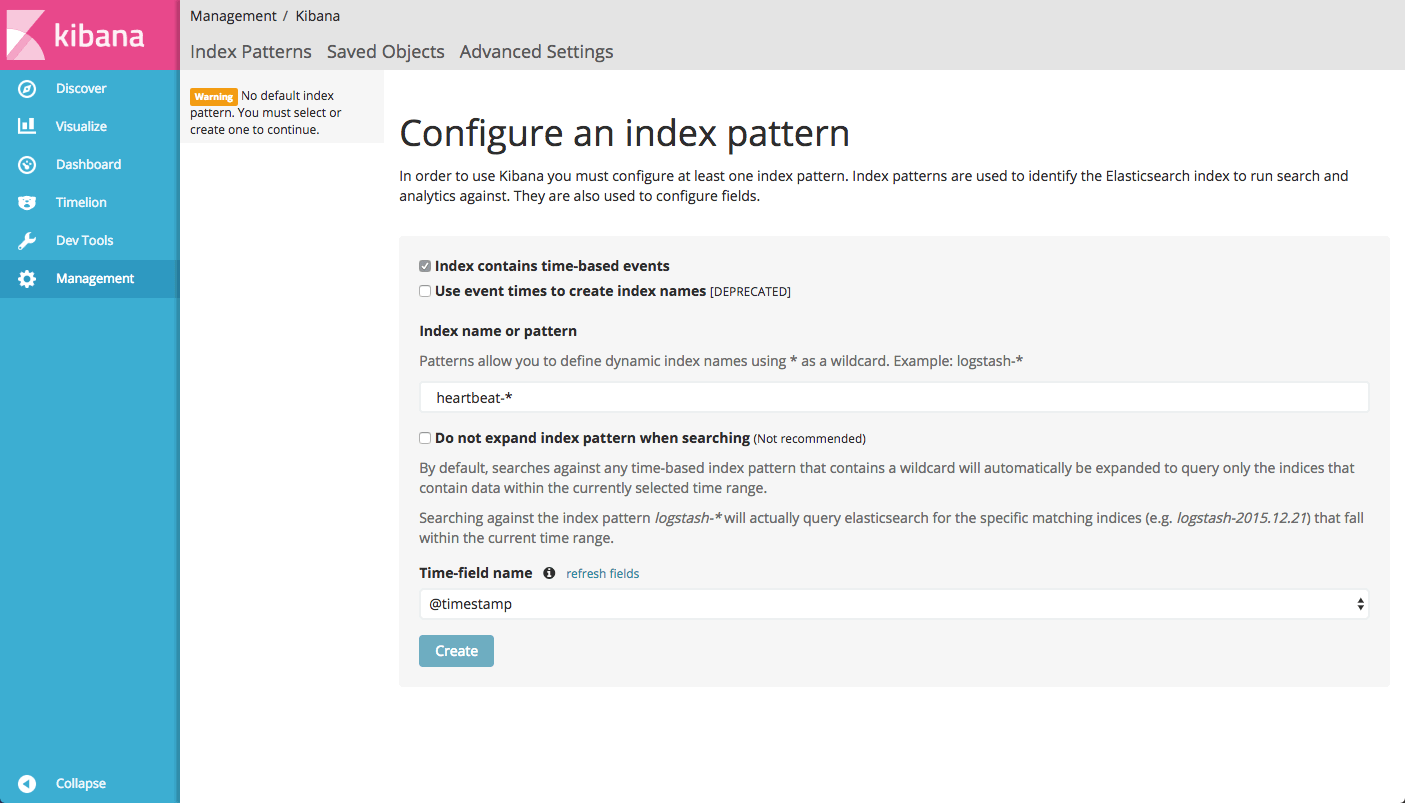
sudo /etc/init.d/heartbeat startYou should see an [ok] output. Within seconds, an index is created and can be defined within Kibana.
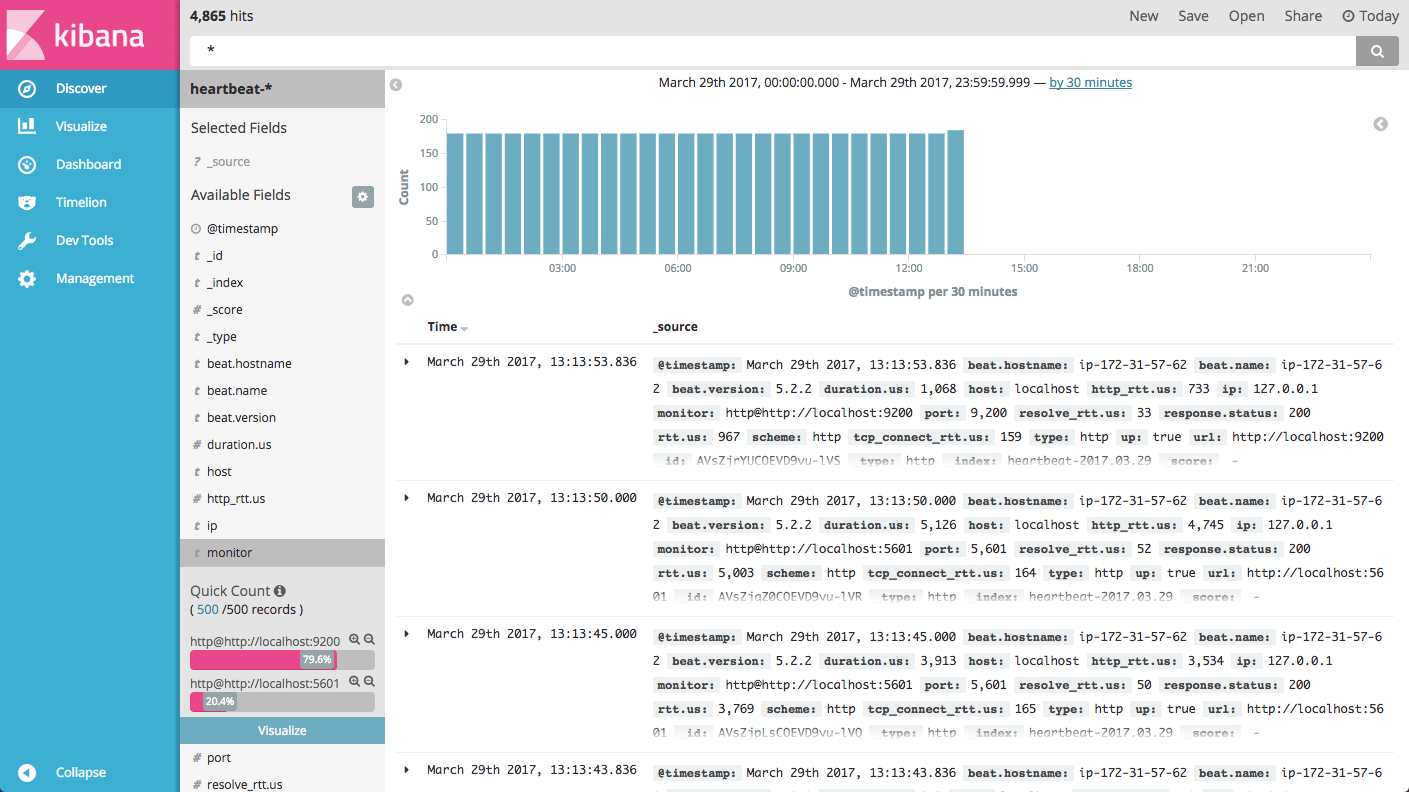
And the data itself:
Note: YAML files are notorious for being extremely syntax-sensitive. I strongly double checking your file with a YAML validator.
Using Heartbeat With Logz.io
To ship the data collected by Heartbeat to the Logz.io ELK Stack, you will need to enter some changes to the configuration file.
First, in the General section, add the following settings (replace the token with your Logz.io user token):
fields:
   env: dev
   logzio_codec: plain
   token: tWMKreYHWcfaBSTPKLRvERFGeiVMpuKL
fields_under_root: true
document_type: heartbeat
Next, download the SSL certificate and copy it to the correct location:
wget <a href="https://raw.githubusercontent.com/logzio/public-certificates/master/COMODORSADomainValidationSecureServerCA.crt">https://raw.githubusercontent.com/logzio/public-certificates/master/COMODORSADomainValidationSecureServerCA.crt</a>

sudo mkdir -p /etc/pki/tls/certs

sudo cp COMODORSADomainValidationSecureServerCA.crt /etc/pki/tls/certs/
And finally, comment out the Elasticsearch output and define the Logz.io Logstash listeners:
output.logstash:
   hosts: ["listener.logz.io:5015"]
   ssl.certificate_authorities: ["/etc/pki/tls/certs/COMODORSADomainValidationSecureServerCA.crt"]
You will need to restart Heartbeat with:
sudo /etc/heartbeat/heartbeat.yml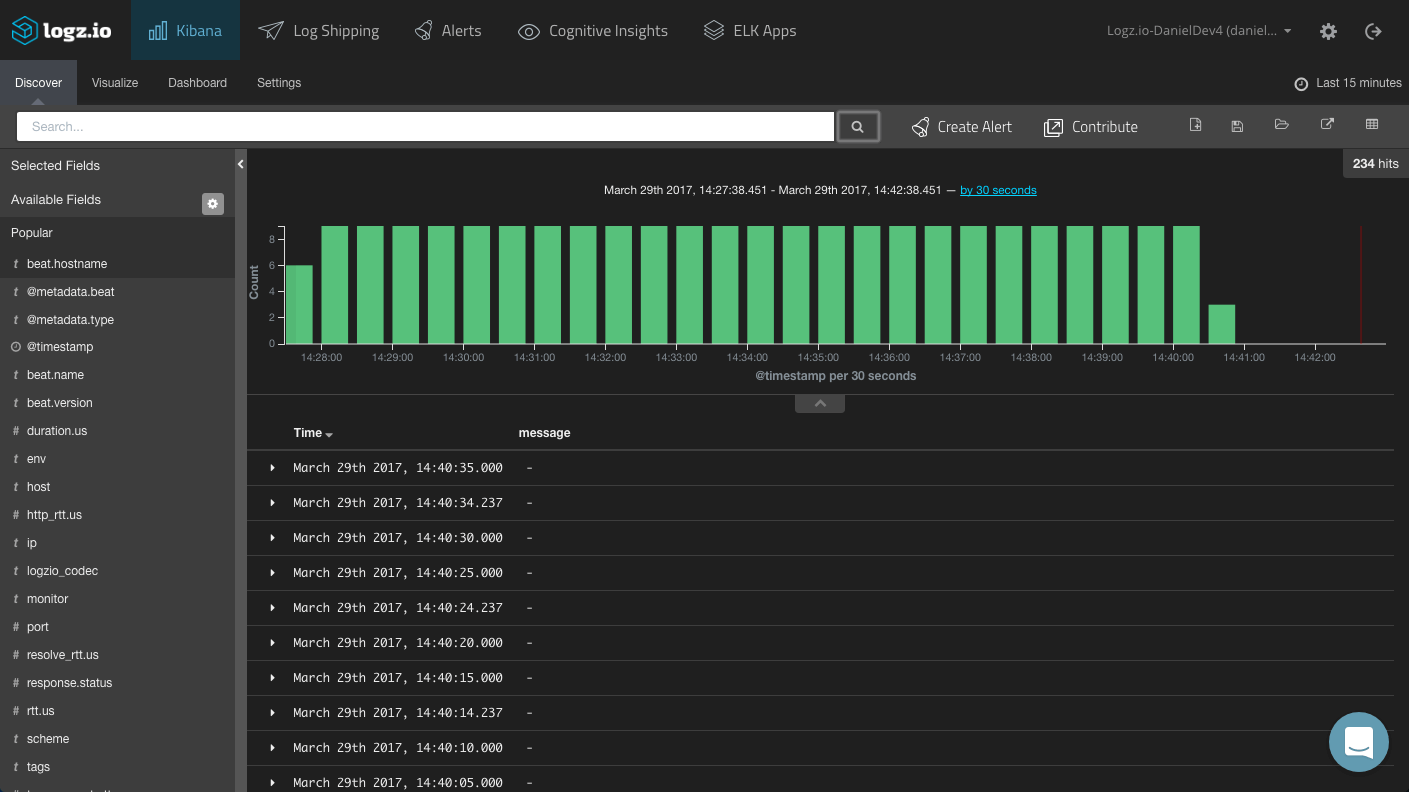
The complete configuration can be found here.
Same note as before: YAML files are notorious for being extremely syntax-sensitive. I strongly double checking your file with a YAML validator.
Analyzing Heartbeat Data
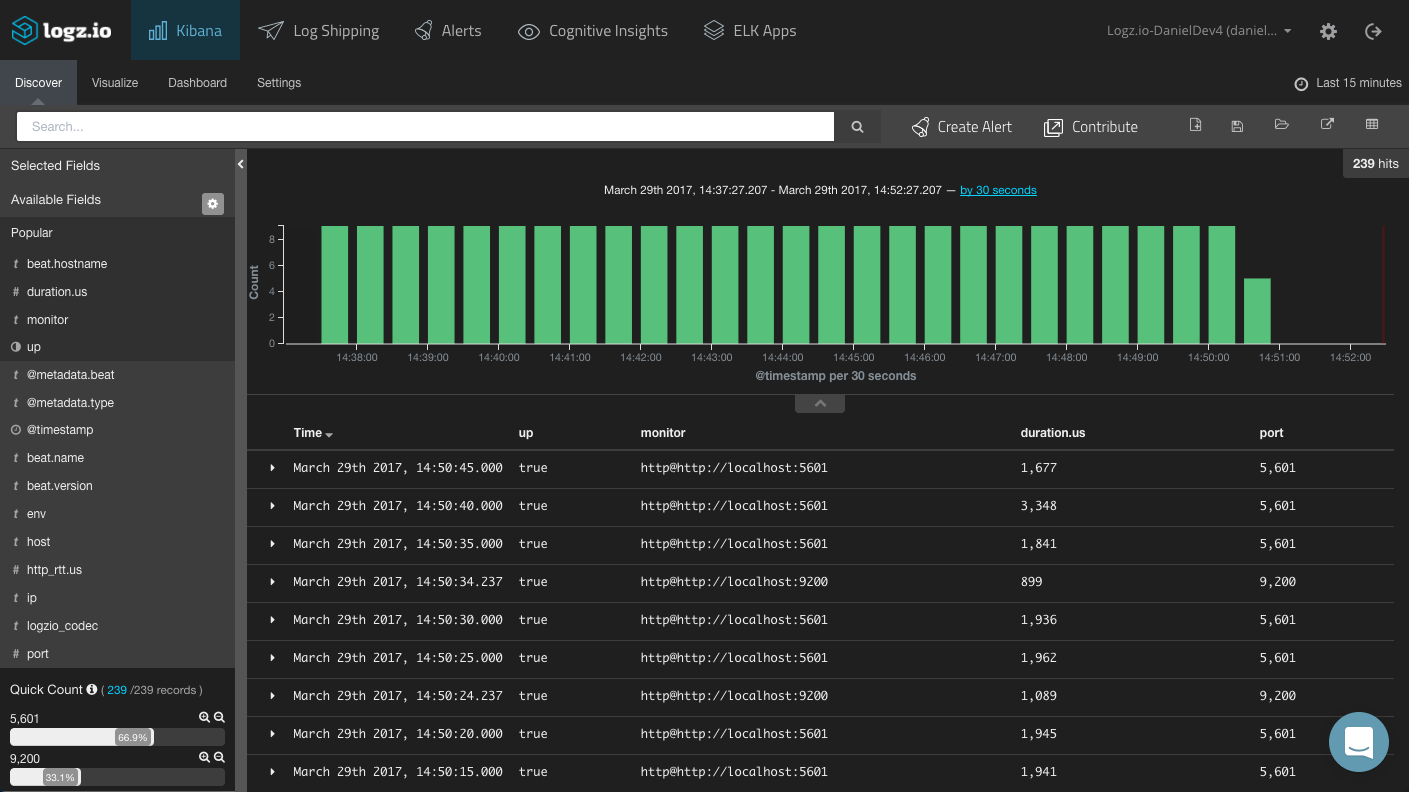
Heartbeat exports a number of useful metrics on the pinged service that are useful in getting insights into the availability of your service. To begin exploring, begin your analysis by taking a look at the fields on the left and adding them to the main display area.
A few fields worth mentioning are:
- Duration fields: These fields can be used to monitor the duration period for the test. For example, the
resolve_rttfield displays the time required to resolve an IP. - response.status: Useful for monitoring the expected status code returned for a service.
- up: This is a boolean indicator that can be used to validate whether a service is available or not.
Dashboarding Heartbeat
As a final step, let’s try to visualize the data and build a dashboard for the data shipped by Heartbeat.
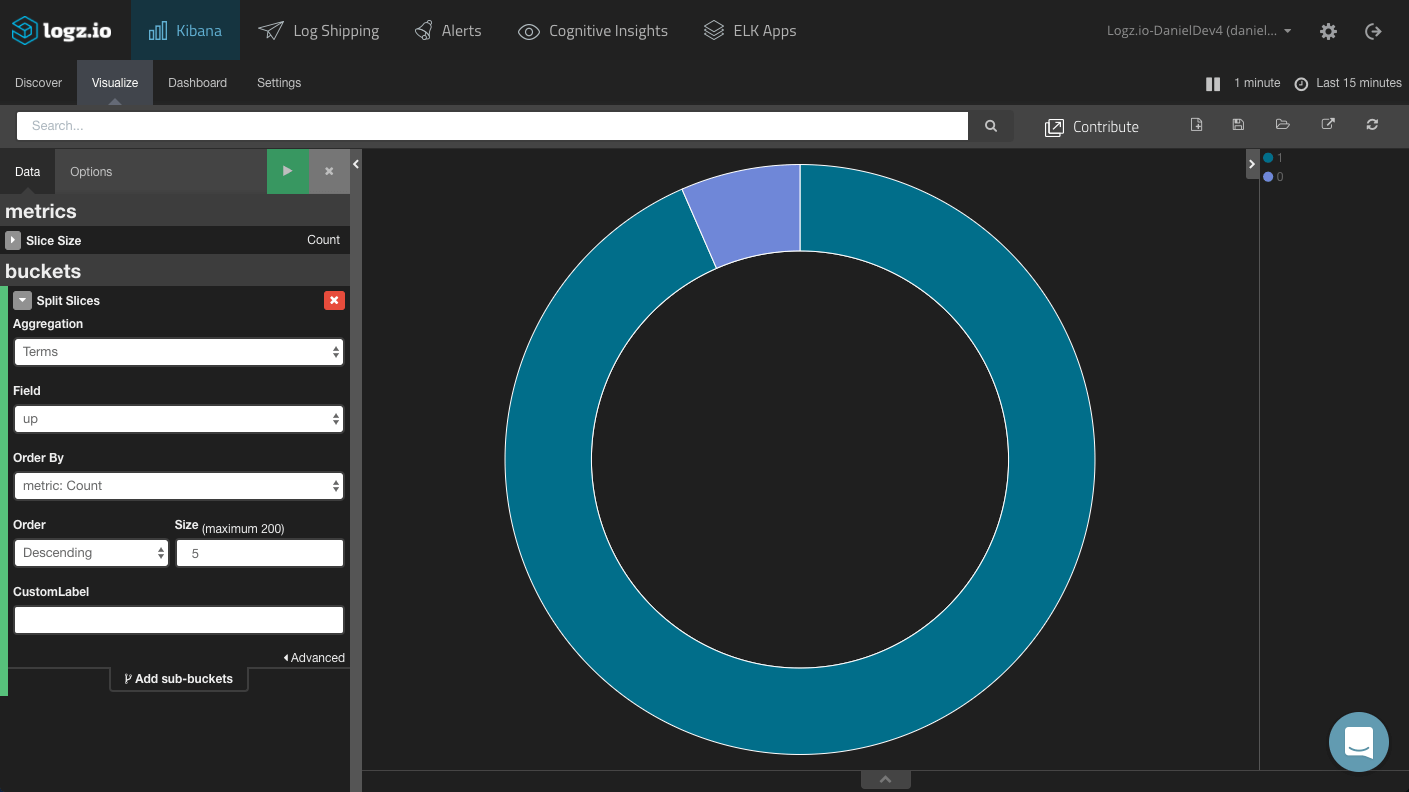
“Up” Pie Chart
A simple pie chart can give you a general overview of how many times services have been down vs. up. The desired ratio is obvious.
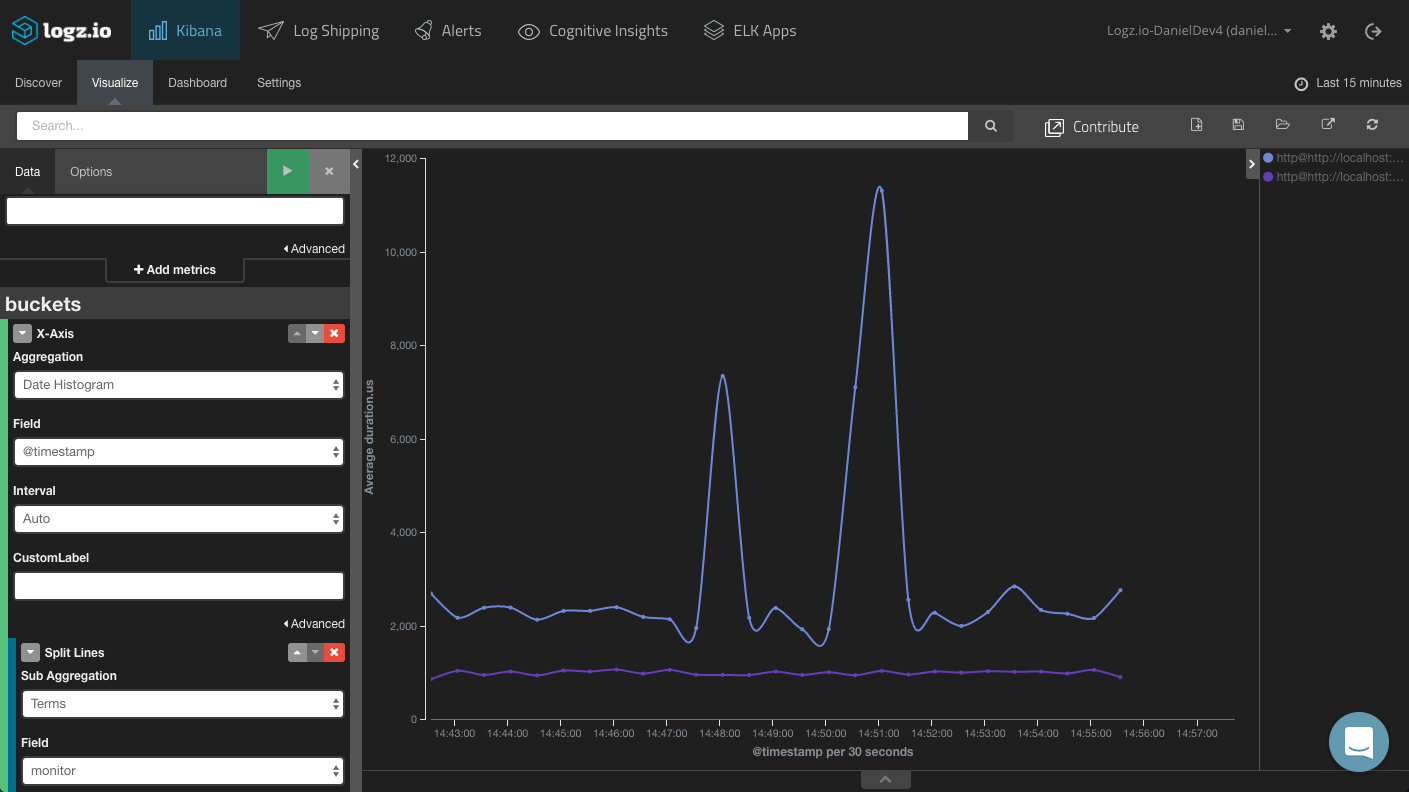
Duration Over Time
Duration is another useful metric to measure. Using a line chart, you can see analyze the average time that pings are taking for your services over time.
Add some single metric visualizations to break down the different duration fields, per service, and the result is a nice monitoring dashboard for your services.
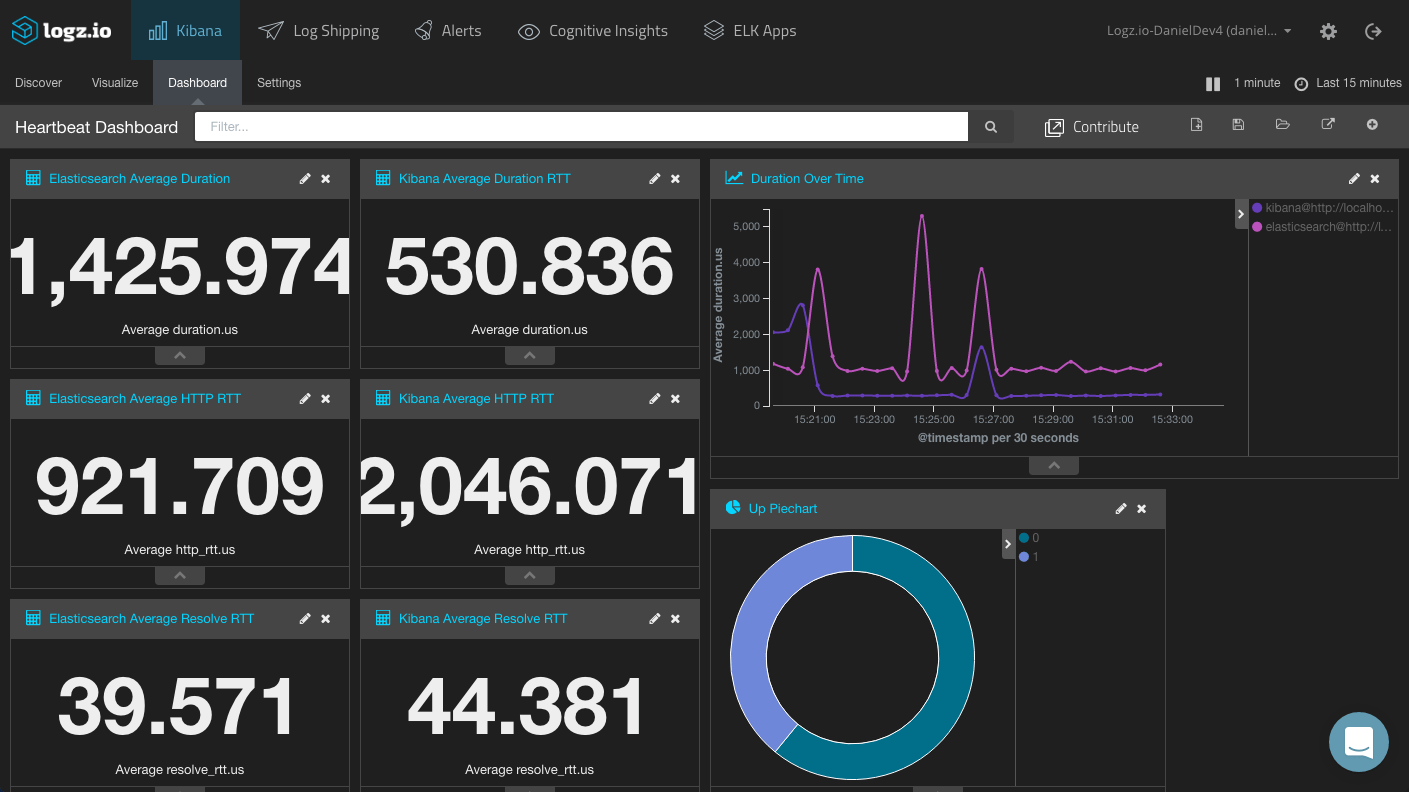
ELK Apps — our library of pre-made Kibana visualizations and dashboards — includes a dashboard for Heartbeat data that you can install to help you get up and running with monitoring your services.
What About Alerting?
Monitoring and alerting go hand in hand in the DevOps world. If you are using your own ELK deployment and are interested in checking out Heartbeat for service uptime monitoring, you need to take into consideration that setting up alerting will require additional configuration and cost.
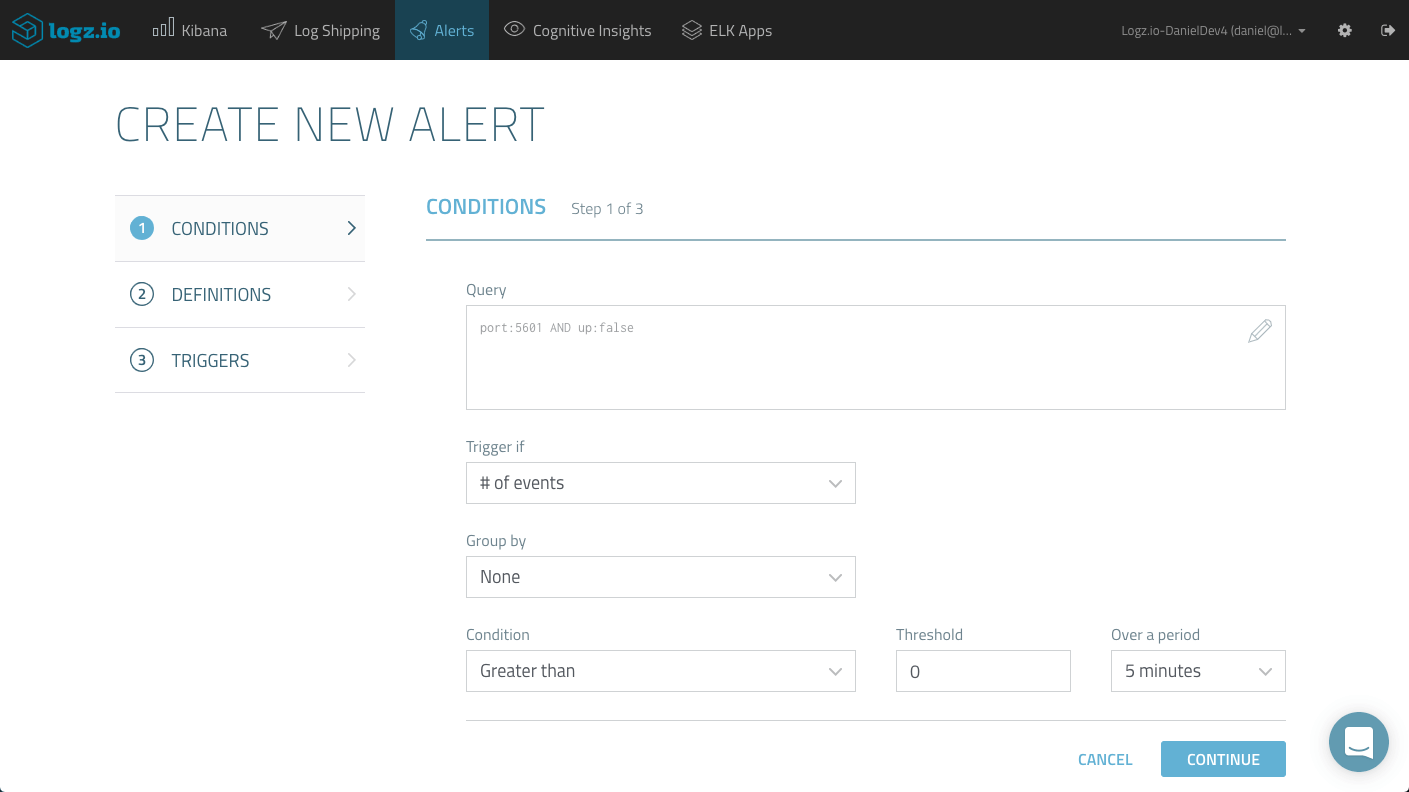
Logz.io provides alerting out of the box with integrations with Slack, PagerDuty, and a variety of other messaging apps that enable you together with Heartbeat to get alerts as soon as a service is down. All you need to do is filter your logs accordingly.
For example, this Kibana query is filtering Heartbeat logs for and downtime experienced by the Kibana service we are monitoring:
port:5601 AND up:falseAll that’s left to do then is hit the Create Alert button and go through the wizard to get notified via your desired channel.
Summary
If you are using an advanced system monitoring and alerting tool such as Nagios, you most likely have no immediate use for Heartbeat.
However, if you have an ELK Stack running, the seamless integration with Logstash and Elasticsearch has its advantages over using external platforms. If you are looking for a lightweight tool for performing periodic service health checks, Heartbeat is an interesting option to check out.
Happy pinging!
Published at DZone with permission of Daniel Berman. See the original article here.
Opinions expressed by DZone contributors are their own.
Comments