

Monte Carlo Estimate for Pi with NumPy

Join the DZone community and get the full member experience.
Join For Free
In this post we will use a Monte Carlo method to approximate pi. The
idea behind the method that we are going to see is the following:
Draw the unit square and the unit circle. Consider only the part of the
circle inside the square and pick uniformly a large number of points at
random over the square. Now, the unit circle has pi/4 the area of the
square. So, it should be apparent that of the total number of points
that hit within the square, the number of points that hit the circle
quadrant is proportional to the area of that part. This gives a way to
approximate pi/4 as the ratio between the number of points inside circle
and the total number of points and multiplying it by 4 we have pi.
Let's see the python script that implements the method discussed above using the numpy's indexing facilities:
from pylab import plot,show,axis
from numpy import random,sqrt,pi

# scattering n points over the unit square
n = 1000000
p = random.rand(n,2)

# counting the points inside the unit circle
idx = sqrt(p[:,0]**2+p[:,1]**2) < 1

plot(p[idx,0],p[idx,1],'b.') # point inside
plot(p[idx==False,0],p[idx==False,1],'r.') # point outside
axis([-0.1,1.1,-0.1,1.1])
show()

# estimation of pi
print '%0.16f' % (sum(idx).astype('double')/n*4),'result'
print '%0.16f' % pi,'real pi'
The program will print the pi approximation on the standard out:
3.1457199999999998 result
3.1415926535897931 real pi
and will show a graph with the generated points:
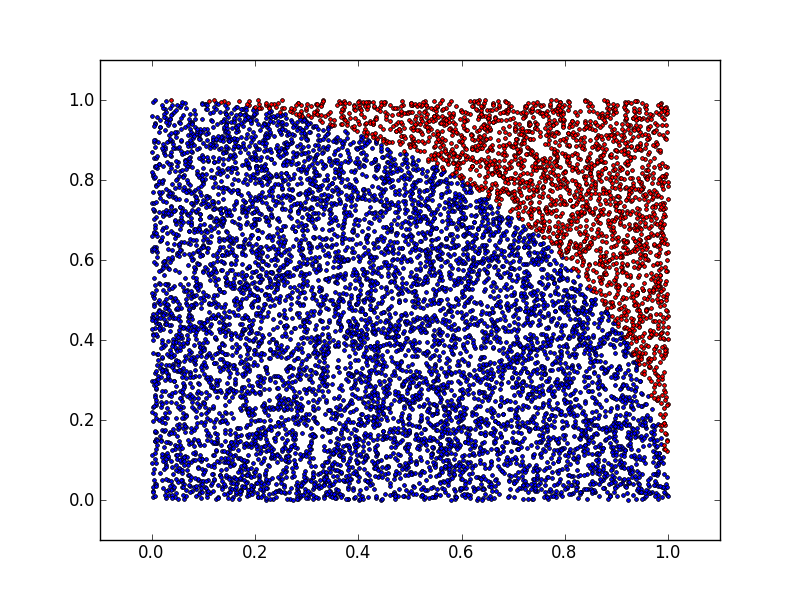
Note that the lines of code used to estimate pi are just 3!
Source: http://glowingpython.blogspot.com/2012/01/monte-carlo-estimate-for-pi-with-numpy.html
Opinions expressed by DZone contributors are their own.
Comments