DZone
Thanks for visiting DZone today,
Edit Profile
  • Manage Email Subscriptions
  • How to Post to DZone
  • Article Submission Guidelines
Sign Out View Profile
  • Post an Article
  • Manage My Drafts
Over 2 million developers have joined DZone.
Log In / Join
Please enter at least three characters to search
Refcards Trend Reports
Events Video Library
Refcards
Trend Reports

Events

View Events Video Library

Zones

Culture and Methodologies Agile Career Development Methodologies Team Management
Data Engineering AI/ML Big Data Data Databases IoT
Software Design and Architecture Cloud Architecture Containers Integration Microservices Performance Security
Coding Frameworks Java JavaScript Languages Tools
Testing, Deployment, and Maintenance Deployment DevOps and CI/CD Maintenance Monitoring and Observability Testing, Tools, and Frameworks
Culture and Methodologies
Agile Career Development Methodologies Team Management
Data Engineering
AI/ML Big Data Data Databases IoT
Software Design and Architecture
Cloud Architecture Containers Integration Microservices Performance Security
Coding
Frameworks Java JavaScript Languages Tools
Testing, Deployment, and Maintenance
Deployment DevOps and CI/CD Maintenance Monitoring and Observability Testing, Tools, and Frameworks

Modernize your data layer. Learn how to design cloud-native database architectures to meet the evolving demands of AI and GenAI workkloads.

Secure your stack and shape the future! Help dev teams across the globe navigate their software supply chain security challenges.

Releasing software shouldn't be stressful or risky. Learn how to leverage progressive delivery techniques to ensure safer deployments.

Avoid machine learning mistakes and boost model performance! Discover key ML patterns, anti-patterns, data strategies, and more.

Related

  • Building a Google Calendar-like Component Using Plain JavaScript
  • Comprehensive Guide to Data Analysis and Visualization With Pandas and Matplotlib
  • From Static to Interactive: Exploring Python's Finest Data Visualization Tools
  • How To Use Pandas and Matplotlib To Perform EDA In Python

Trending

  • How to Build Scalable Mobile Apps With React Native: A Step-by-Step Guide
  • Artificial Intelligence, Real Consequences: Balancing Good vs Evil AI [Infographic]
  • Measuring the Impact of AI on Software Engineering Productivity
  • Comparing SaaS vs. PaaS for Kafka and Flink Data Streaming

Plotting a Calendar in Matplotlib

We quickly go through the code you'll need to get started working with this popular and open source Python library and plotting your data!

By 
Giuseppe Vettigli user avatar
Giuseppe Vettigli
·
Apr. 15, 19 · Tutorial
Likes (3)
Comment
Save
Tweet
Share
12.2K Views

Join the DZone community and get the full member experience.

Join For Free

And here's a function to plot a compact calendar with matplotlib:

import calendar
import numpy as np
from matplotlib.patches import Rectangle
import matplotlib.pyplot as plt

def plot_calendar(days, months):
    plt.figure(figsize=(9, 3))
    # non days are grayed
    ax = plt.gca().axes
    ax.add_patch(Rectangle((29, 2), width=.8, height=.8, 
                           color='gray', alpha=.3))
    ax.add_patch(Rectangle((30, 2), width=.8, height=.8,
                           color='gray', alpha=.5))
    ax.add_patch(Rectangle((31, 2), width=.8, height=.8,
                           color='gray', alpha=.5))
    ax.add_patch(Rectangle((31, 4), width=.8, height=.8,
                           color='gray', alpha=.5))
    ax.add_patch(Rectangle((31, 6), width=.8, height=.8,
                           color='gray', alpha=.5))
    ax.add_patch(Rectangle((31, 9), width=.8, height=.8,
                           color='gray', alpha=.5))
    ax.add_patch(Rectangle((31, 11), width=.8, height=.8,
                           color='gray', alpha=.5))
    for d, m in zip(days, months):
        ax.add_patch(Rectangle((d, m), 
                               width=.8, height=.8, color='C0'))
    plt.yticks(np.arange(1, 13)+.5, list(calendar.month_abbr)[1:])
    plt.xticks(np.arange(1,32)+.5, np.arange(1,32))
    plt.xlim(1, 32)
    plt.ylim(1, 13)
    plt.gca().invert_yaxis()
    # remove borders and ticks
    for spine in plt.gca().spines.values():
        spine.set_visible(False)
    plt.tick_params(top=False, bottom=False, left=False, right=False)
    plt.show()

You can use it to highlight the days with full moon in 2018:

full_moon_day = [2, 31, 2, 31, 30, 29, 28, 27, 26, 25, 24, 23, 22]
full_moon_month = [1, 1, 3, 3, 4, 5, 6, 7, 8, 9, 10, 11, 12]
plot_calendar(full_moon_day, full_moon_month)

Matplotlib

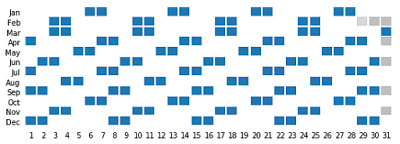
Or just highlight all the weekends:

from datetime import datetime, timedelta

def get_weekends(year):
    weekend_day = []
    weekend_month = [] 
    start = datetime(year, 1, 1)
    for i in range(365):
        day_of_the_year = start + timedelta(days=i)
        if day_of_the_year.weekday() > 4:
            weekend_day.append(day_of_the_year.day)
            weekend_month.append(day_of_the_year.month)
    return weekend_day, weekend_month

weekend_day, weekend_month = get_weekends(2018)
plot_calendar(weekend_day, weekend_month)
Matplotlib

Calendar (Apple) Matplotlib

Published at DZone with permission of Giuseppe Vettigli, DZone MVB. See the original article here.

Opinions expressed by DZone contributors are their own.

Related

  • Building a Google Calendar-like Component Using Plain JavaScript
  • Comprehensive Guide to Data Analysis and Visualization With Pandas and Matplotlib
  • From Static to Interactive: Exploring Python's Finest Data Visualization Tools
  • How To Use Pandas and Matplotlib To Perform EDA In Python

Partner Resources

×

Comments
Oops! Something Went Wrong

The likes didn't load as expected. Please refresh the page and try again.

ABOUT US

  • About DZone
  • Support and feedback
  • Community research
  • Sitemap

ADVERTISE

  • Advertise with DZone

CONTRIBUTE ON DZONE

  • Article Submission Guidelines
  • Become a Contributor
  • Core Program
  • Visit the Writers' Zone

LEGAL

  • Terms of Service
  • Privacy Policy

CONTACT US

  • 3343 Perimeter Hill Drive
  • Suite 100
  • Nashville, TN 37211
  • support@dzone.com

Let's be friends:

Likes
There are no likes...yet! 👀
Be the first to like this post!
It looks like you're not logged in.
Sign in to see who liked this post!