How to Publish Spring Boot Actuator Metrics to Dynatrace
The metrics generated by the Spring Boot Actuator module of Spring Boot can be easily published to a Dynatrace cloud instance.
Join the DZone community and get the full member experience.
Join For Free
The metrics generated by the Spring Boot Actuator module of Spring Boot can be easily published to a Dynatrace cloud instance. This article will give you a step-by-step guide for obtaining that.
Prerequisites:
- JDK 8+
- Maven 3.x
- A Dynatrace cloud instance, you can create it for a 15-days free trial very quickly (try it).
- A Dynatrace OneAgent installed on your environment, you can install it on Linux and Windows.
If you do not have the OneAgent installed, please:
- Download the installer from the Deploy Dynatrace web page of your Dynatrace instance (you need administrator rights).
- Asks a proper administrator to install OneAgent on your PC.
- Asks a proper administrator to give you access to an environment having the OneAgent already installed and where you can run the PoC that we are going to develop.
Generate a Dynatrace API token
Spring Boot Actuator uses Micrometer and the metrics will be published thanks to the Micrometer integration with Dynatrace.
If you give a look at the source code it is possible to verify that Micrometer uses the Custom Device and Timeseries API exposed by Dynatrace. But, before using any Dynatrace API, you have to generate an API token.
Please note that for generating an API token you need administrator rights on your Dynatrace instance or otherwise you have to ask a proper administrator to generate that token for you.
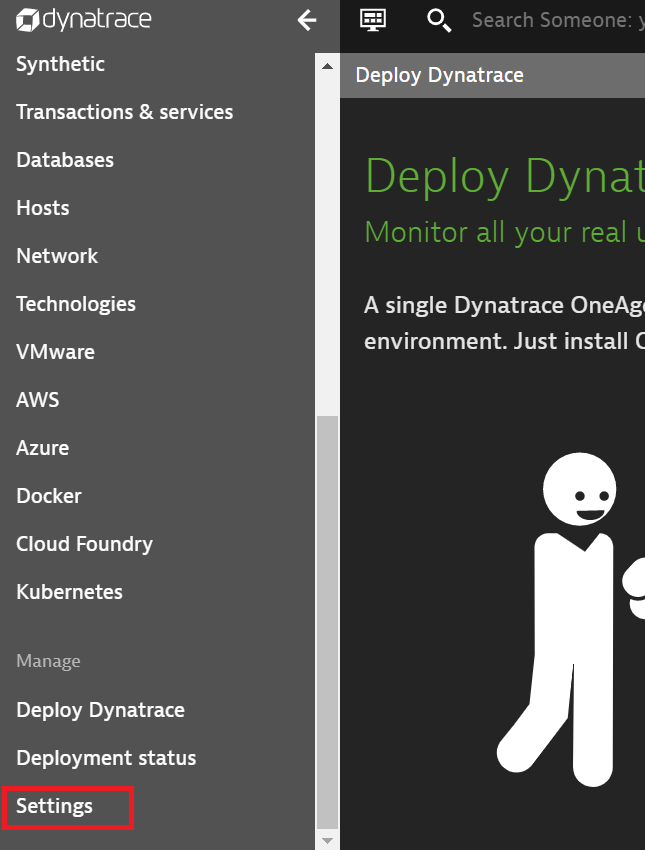
Login to your Dynatrace instance and open the Settings menu in the bottom left panel:
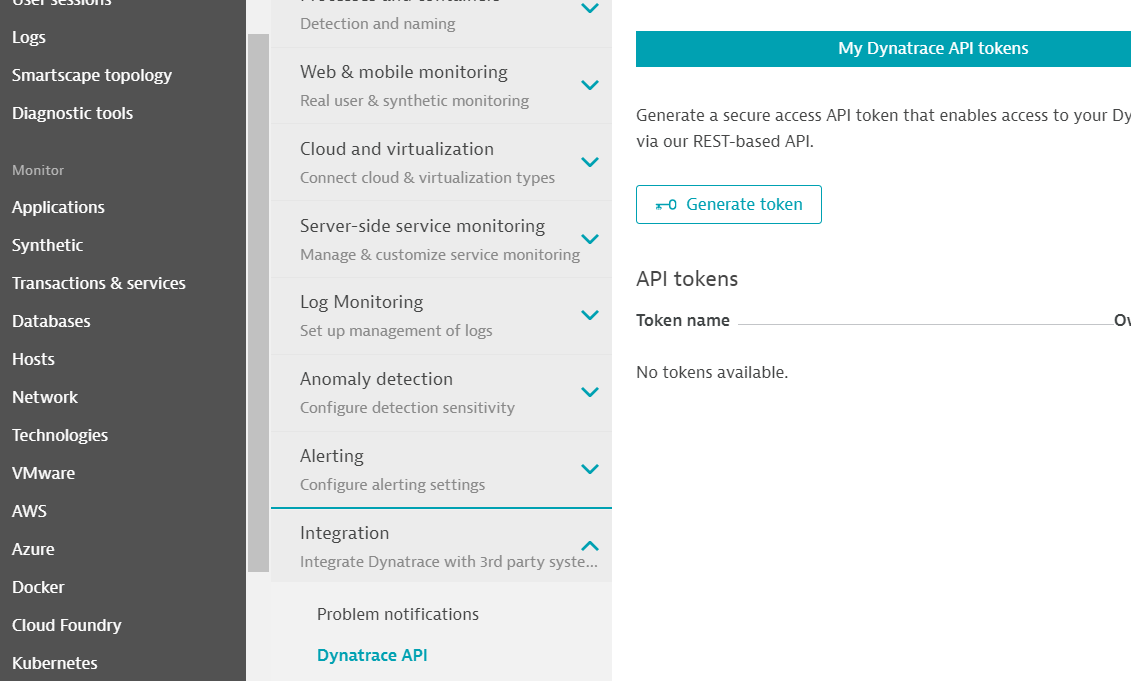
Open the Integration -> Dynatrace API page and clicks the Generate token button.
Type a name for identifying the token (for example spring_boot_poc) and clicks the Generate button visible scrolling down the page and your new brand new token will be created.
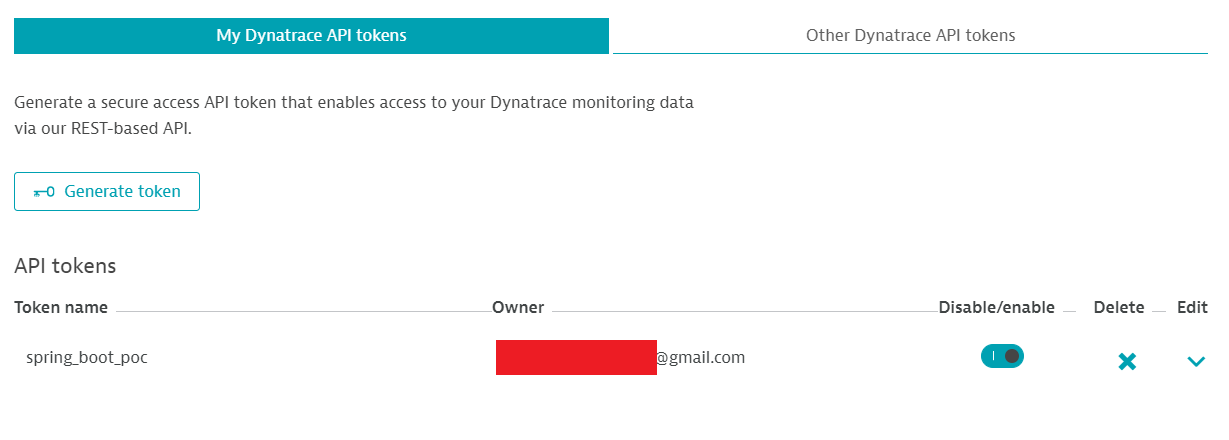
You can read the API token value by clicking the arrow under Edit.
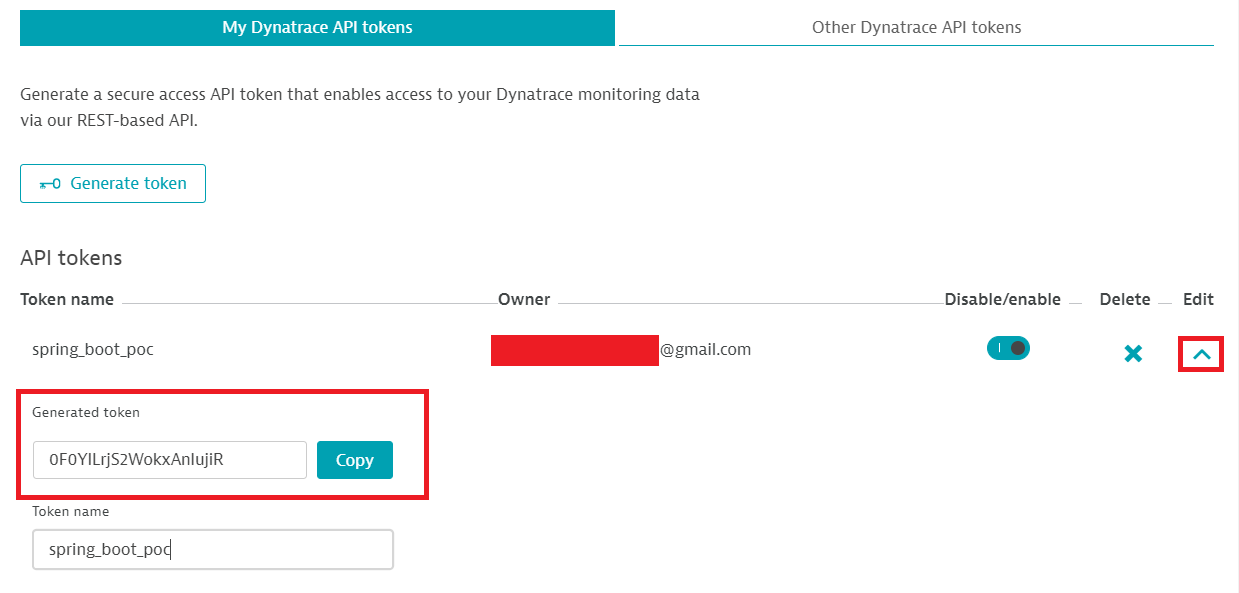
Copy the token value and keep it in a safe place.
Create a Spring Boot app
A simple "Hello World!" Spring Boot app will be enough for publishing some custom metrics to Dynatrace.
It is possible to copy and paste the file contents described below or (more quickly) to clone this GitHub repository.
The pom.xml file will be:
<project xmlns="http://maven.apache.org/POM/4.0.0" xmlns:xsi="http://www.w3.org/2001/XMLSchema-instance"
xsi:schemaLocation="http://maven.apache.org/POM/4.0.0 https://maven.apache.org/xsd/maven-4.0.0.xsd">
<modelVersion>4.0.0</modelVersion>
<parent>
<groupId>org.springframework.boot</groupId>
<artifactId>spring-boot-starter-parent</artifactId>
<version>2.2.3.BUILD-SNAPSHOT</version>
<relativePath/> <!-- lookup parent from repository -->
</parent>
<groupId>com.example</groupId>
<artifactId>demo</artifactId>
<version>0.0.1-SNAPSHOT</version>
<name>demo</name>
<description>Demo project for Spring Boot</description>
<properties>
<project.build.sourceEncoding>UTF-8</project.build.sourceEncoding>
<java.version>1.8</java.version>
<maven.compiler.source>1.8</maven.compiler.source>
<maven.compiler.target>1.8</maven.compiler.target>
</properties>
<dependencies>
<dependency>
<groupId>org.springframework.boot</groupId>
<artifactId>spring-boot-starter-web</artifactId>
</dependency>
<!-- Enable Spring Boot Actuator -->
<dependency>
<groupId>org.springframework.boot</groupId>
<artifactId>spring-boot-starter-actuator</artifactId>
</dependency>
<!-- Add this dependency for publishing Actuator metrics to Dynatrace -->
<dependency>
<groupId>io.micrometer</groupId>
<artifactId>micrometer-registry-dynatrace</artifactId>
</dependency>
</dependencies>
<build>
<plugins>
<plugin>
<groupId>org.springframework.boot</groupId>
<artifactId>spring-boot-maven-plugin</artifactId>
</plugin>
</plugins>
</build>
<repositories>
<repository>
<id>spring-milestones</id>
<name>Spring Milestones</name>
<url>https://repo.spring.io/milestone</url>
</repository>
<repository>
<id>spring-snapshots</id>
<name>Spring Snapshots</name>
<url>https://repo.spring.io/snapshot</url>
<snapshots>
<enabled>true</enabled>
</snapshots>
</repository>
</repositories>
<pluginRepositories>
<pluginRepository>
<id>spring-milestones</id>
<name>Spring Milestones</name>
<url>https://repo.spring.io/milestone</url>
</pluginRepository>
<pluginRepository>
<id>spring-snapshots</id>
<name>Spring Snapshots</name>
<url>https://repo.spring.io/snapshot</url>
<snapshots>
<enabled>true</enabled>
</snapshots>
</pluginRepository>
</pluginRepositories>
</project>
Please note that:
- The Spring Boot version used is 2.2.3 (SNAPSHOT) because it fixes this bug and so it is possible to set the
management.metrics.export.dynatrace.groupproperty (seeapplication.propertiesfile configuration later). Currently, the final Spring Boot 2.2.3 version has not yet been released. - The pom contains the
spring-boot-starter-actuatordependency for enabling Spring Boot Actuator. - The pom contains the
micrometer-registry-dynatracedependency needed for publishing the custom metrics to Dynatrace.
Create a simple Spring Boot controller in HelloWorldController.java:
xxxxxxxxxx
package com.example.demo;
import org.springframework.web.bind.annotation.RequestMapping;
import org.springframework.web.bind.annotation.RestController;
public class HelloWorldController {
("/")
public String index() {
return "Hello World!";
}
}
Create a Spring Boot initialization class like the following App.java:
xxxxxxxxxx
package com.example.demo;
import org.springframework.boot.SpringApplication;
import org.springframework.boot.autoconfigure.SpringBootApplication;
public class App {
public static void main(String[] args) {
SpringApplication.run(App.class, args);
}
}
Enable the Spring Boot Actuator health and metrics endpoints in the application.properties file:
xxxxxxxxxx
# Expose the health and metrics endpoints
management.endpoints.web.exposure.include=health, metrics
Build and start the Spring Boot app in one shot with the following command:
xxxxxxxxxx
mvn spring-boot:run
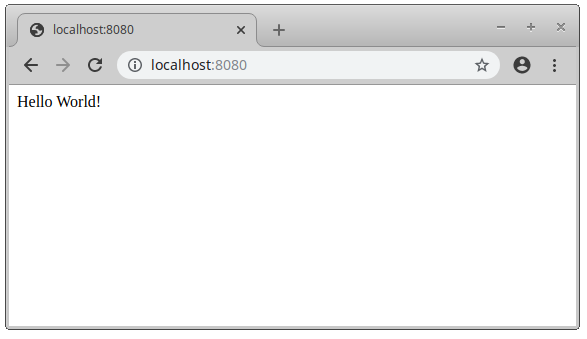
You can check that the application is running properly by putting http://localhost:8080 in your web browser.
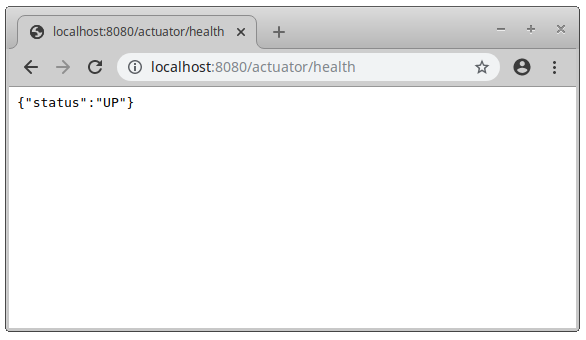
You can verify that the Spring Boot Actuator module is running by putting http://localhost:8080/actuator/health in your web browser.
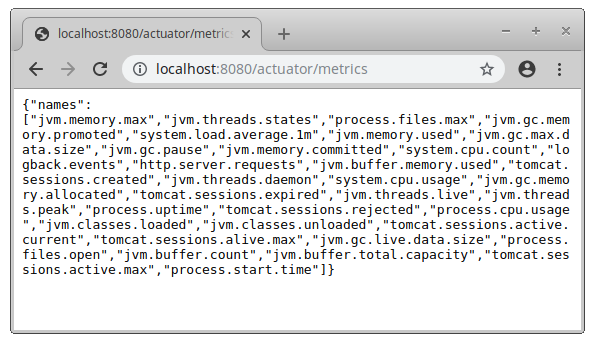
And, finally, checks that the Spring Boot Actuator metrics are collected by putting http://localhost:8080/actuator/metrics in your web browser.
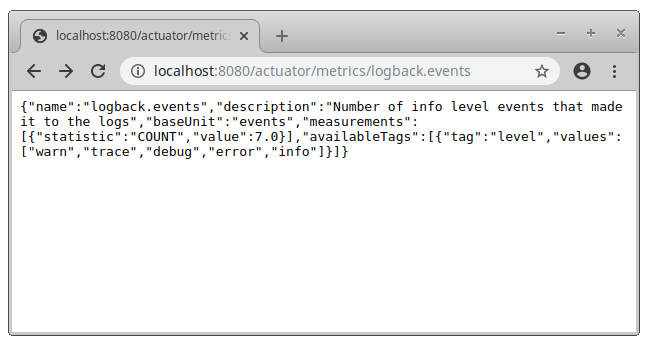
You can check the value of a single metric by adding to the previous URL the metric name. For example http://localhost:8080/actuator/metrics/logback.events.
Please note that, if the Dynatrace OneAgent was installed correctly, you should already see the HelloWorldController Spring Boot app in your Dynatrace instance by clicking Transactions and services in the left panel.

Publish the Custom Metrics to Dynatrace
For enabling the publication of the custom metrics to Dynatrace modify the application.properties file as below:
xxxxxxxxxx
# Expose the health and metrics endpoints
management.endpoints.web.exposure.include=health, metrics
# The Dynatrace instance URL
management.metrics.export.dynatrace.uri=https://xxxxxxxx.live.dynatrace.com
# The Dynatrace API token generated
management.metrics.export.dynatrace.api-token=0F0YILrjS2WokxAnlujiR
# The Device ID passed to Dynatrace API (could be an hostname or a pod name)
management.metrics.export.dynatrace.device-id=myhostname
# The Process Group passed to Dynatrace API (could be the application name)
# Be aware that this property works properly only from Spring Boot 2.2.3.RELEASE
management.metrics.export.dynatrace.group=spring_boot_poc
# The interval at which metrics are sent to Dynatrace (default 1 minute)
management.metrics.export.dynatrace.step=1m
#################################################
### IMPORTANT: Set to true for publishing the ###
### custom metrics to Dynatrace. ###
#################################################
management.metrics.export.dynatrace.enabled=true
Please note that:
- Your Dynatrace instance URL has to be set in the
management.metrics.export.dynatrace.uriproperty. - Your Dynatrace API token has to be set in the
management.metrics.export.dynatrace.api-tokenproperty. - Do not forget to set the
management.metrics.export.dynatrace.enabledproperty totrue.
Rebuild and restart the Spring Boot app with the command:
xxxxxxxxxx
mvn spring-boot:run
If your configuration is correct, you should see the following message in the Spring Boot console log:
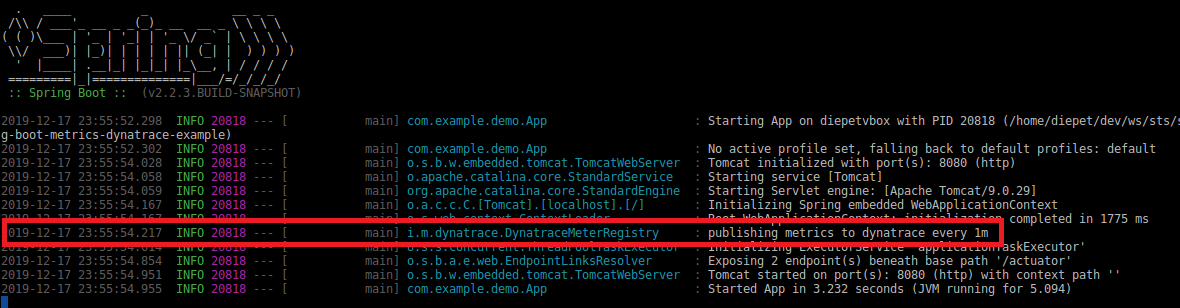
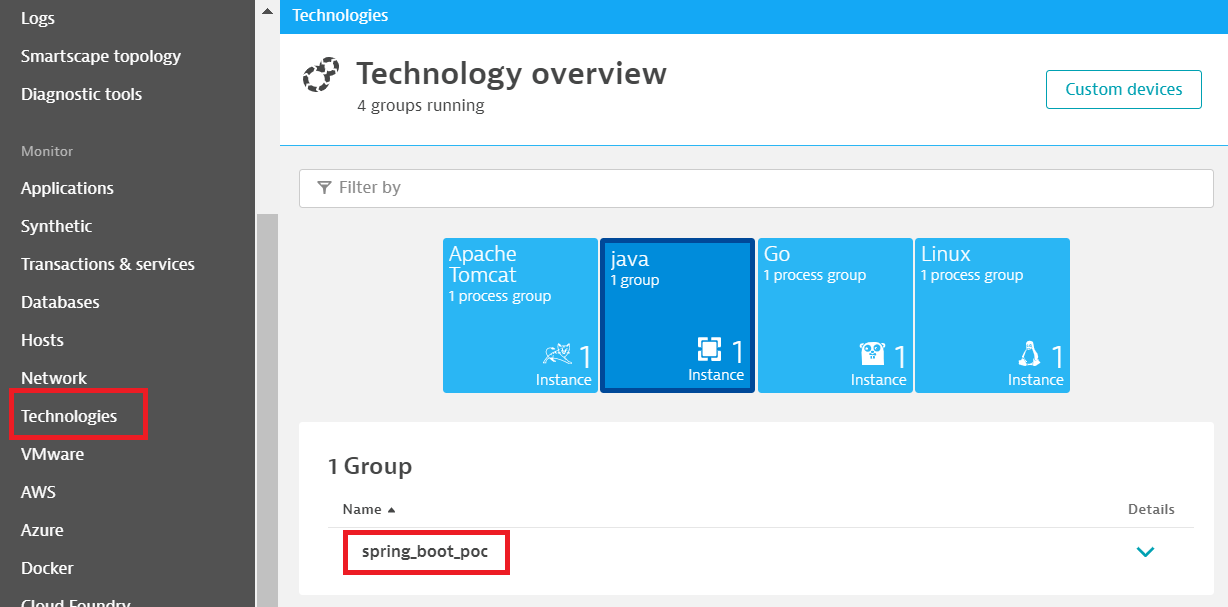
Wait for 1-2 minutes and enter in your Dynatrace instance. Open the Technologies page on the left menu and clicks the java quadrant for showing the process group set in the management.metrics.export.dynatrace.group property previously. Please note that if you are using a Spring Boot version lower than 2.2.3 you could see a random alphanumeric string prefixed with UNKNOWN CUSTOM_DEVICE_GROUP (this is a Spring Boot issue fixed here).
Clicks the arrow under Details and then the Group details button.
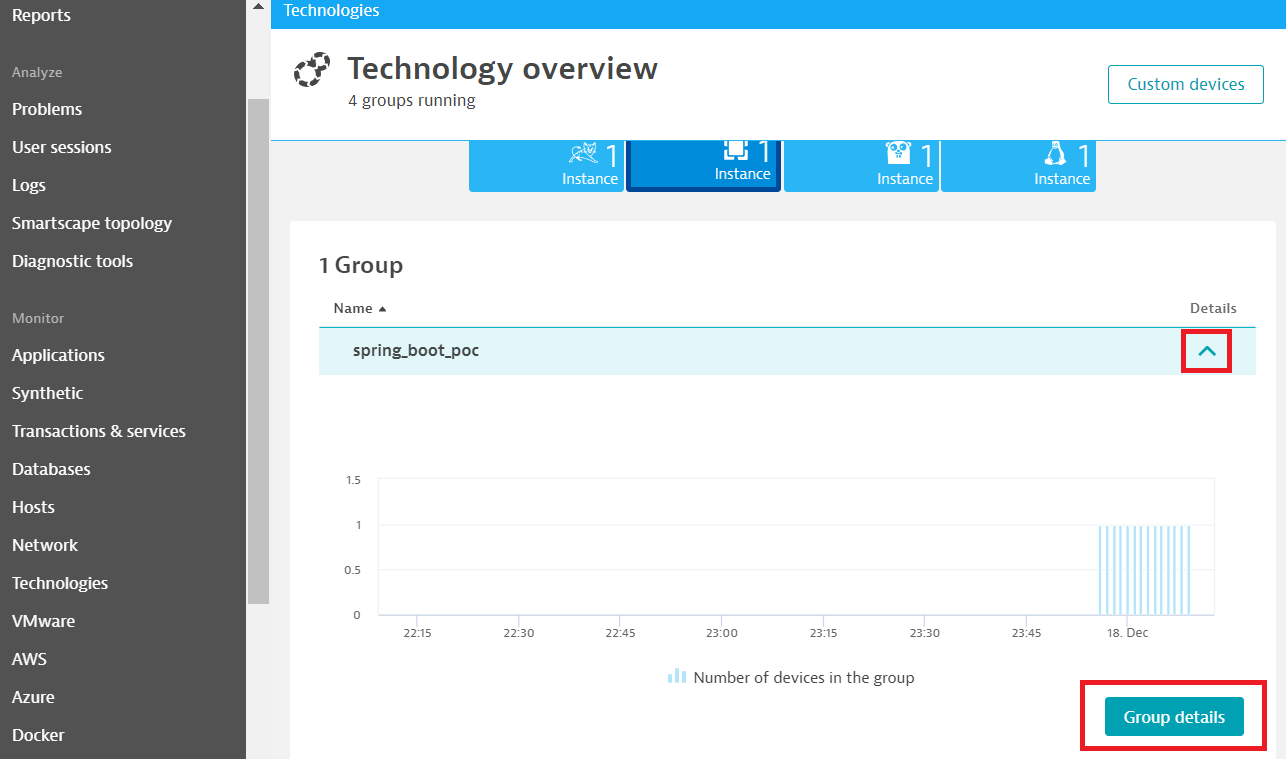
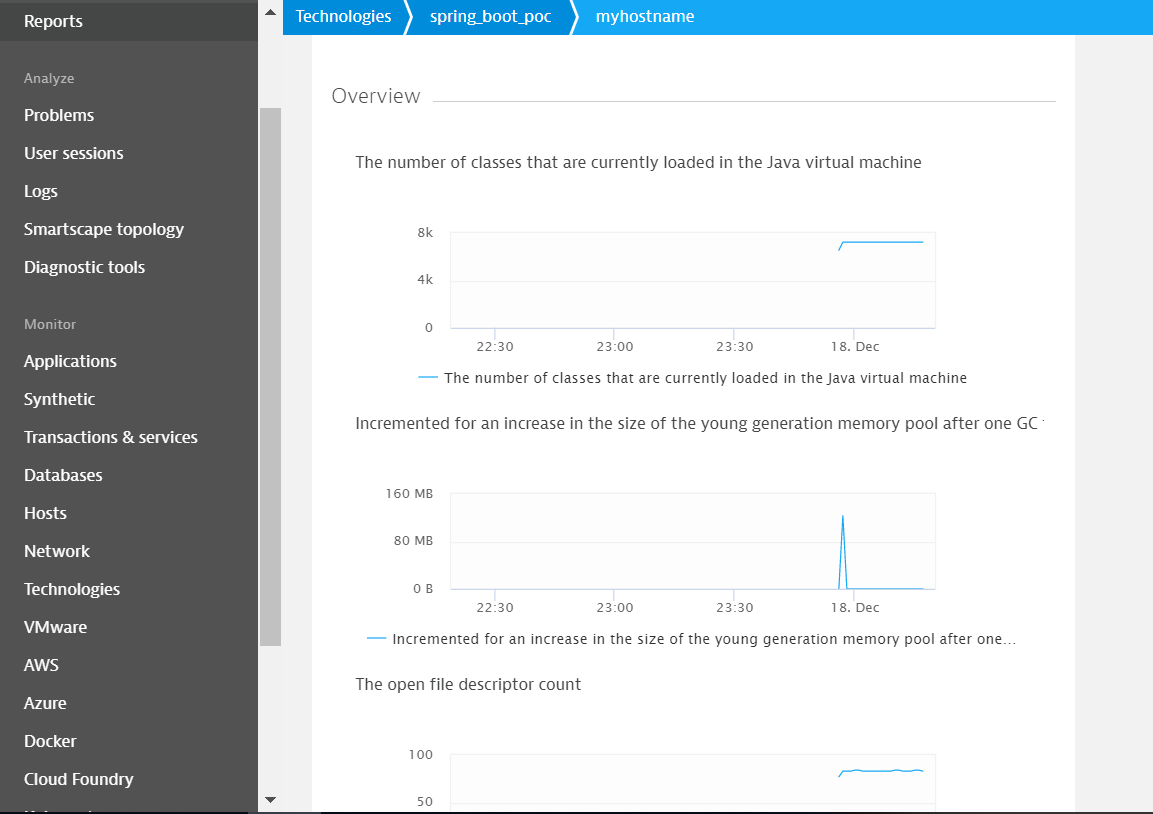
In the bottom of the web page, you can see the device set in the management.metrics.export.dynatrace.device-id property previously.
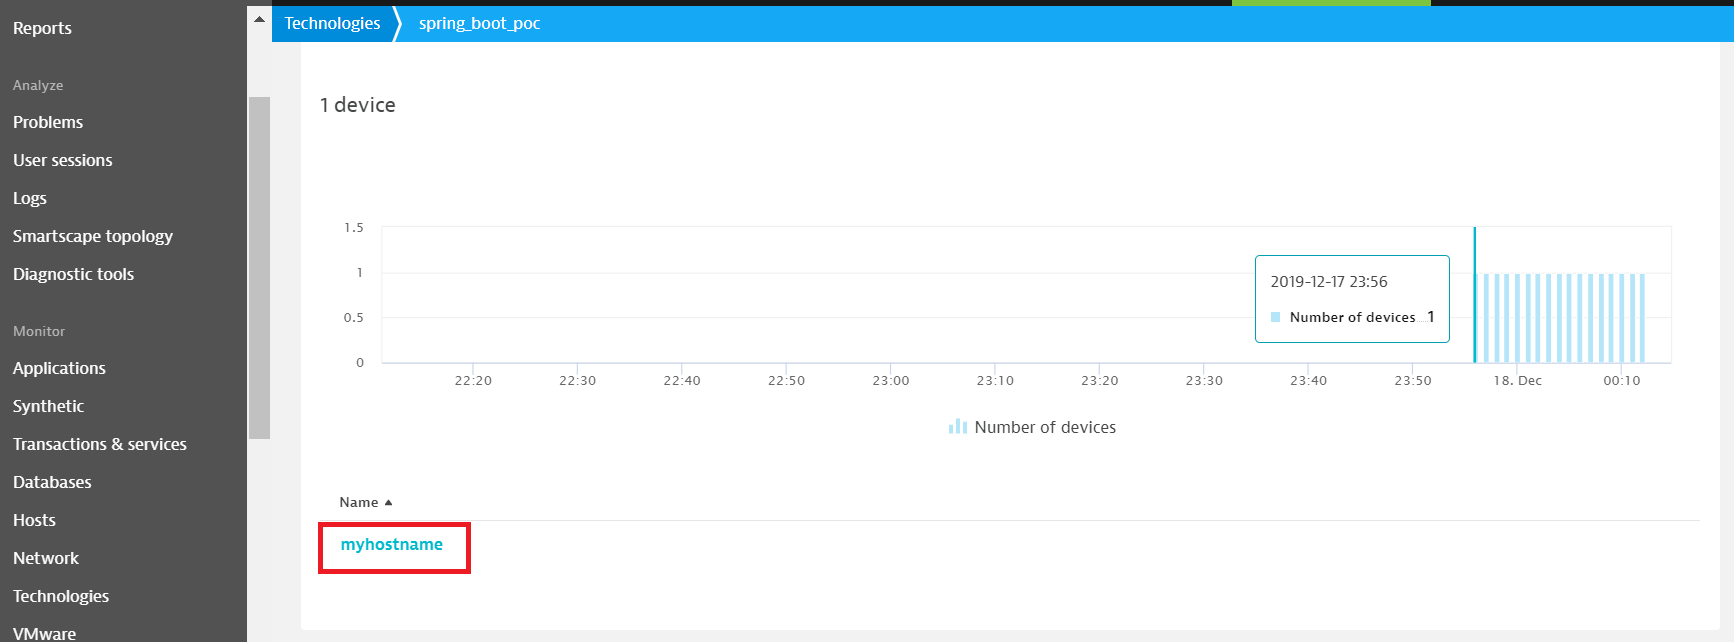
Finally, clicks on the device name and you will see the graphs of your metrics!
Conclusions
This is a guide for publishing the Spring Boot Actuator metrics (collected by using Micrometer) to Dynatrace.
In our example the metrics published are very simple, checks the Spring Boot Actuator documentation for a full list of the supported metrics (caches, connection pools, and other useful metrics can be enabled automatically).
You can create (and publish) custom metrics by injecting a MeterRegistry instance as explained here. Use the Micrometer API for registering new metrics.
And last but not least, try to create custom charts on Dynatrace for a nice visualization of your metrics (check the documentation).
Enjoy your ad-hoc metrics to Dynatrace!
Opinions expressed by DZone contributors are their own.
Comments