Query Store Wait Statistics With sys.query_store_wait_stats
I absolutely love Query Store. But it's easy to get your data all jumbled up when sys.query_store_wait_stats comes into the mix.
Join the DZone community and get the full member experience.
Join For FreeThe second best thing to answering questions that people ask is when I sit down to write a book. It's so easy to miss things in the day-to-day grind of doing work. Then, late at night, you're working on a chapter, so you read up on the documentation to ensure that you're not missing anything. Of course, then you find, yes, you are missing something. In my case, sys.query_store_wait_stats.
sys.query_store_wait_stats
If you follow the link above, it'll give you what you need to know. But I figured I'd provide a little more clarity because I think there are some pitfalls in using this data.
I love Query Store (do a search to see all the exploration I've done with it). One of my favorite things is the time intervals. It breaks the aggregates of the runtime data, and now the wait statistics, into smaller chunks of time (one hour by default). Why is this so wonderful? Because it gives you a "before" and "after" so that you can compare how the query is behaving now to yesterday or yesterday to last week or... check out this blog post that includes a query to get the work done.
Now, if you read the docs, you're likely to write a query something like this:
SELECT qsq.query_id,
       qsp.plan_id,
       qsp.query_plan,
       qsrs.avg_duration,
       qsrs.stdev_duration,
       qsws.wait_category_desc,
       qsws.avg_query_wait_time_ms,
       qsws.stdev_query_wait_time_ms
FROM sys.query_store_query AS qsq
    JOIN sys.query_store_plan AS qsp
        ON qsp.query_id = qsq.query_id
    JOIN sys.query_store_runtime_stats AS qsrs
        ON qsrs.plan_id = qsp.plan_id
    JOIN sys.query_store_wait_stats AS qsws
        ON qsws.plan_id = qsp.plan_id
WHERE qsq.object_id = OBJECT_ID('dbo.ProductTransactionHistoryByReference');
Why do I say that? Because that's what I did. The problem is, the data returned looks like this:
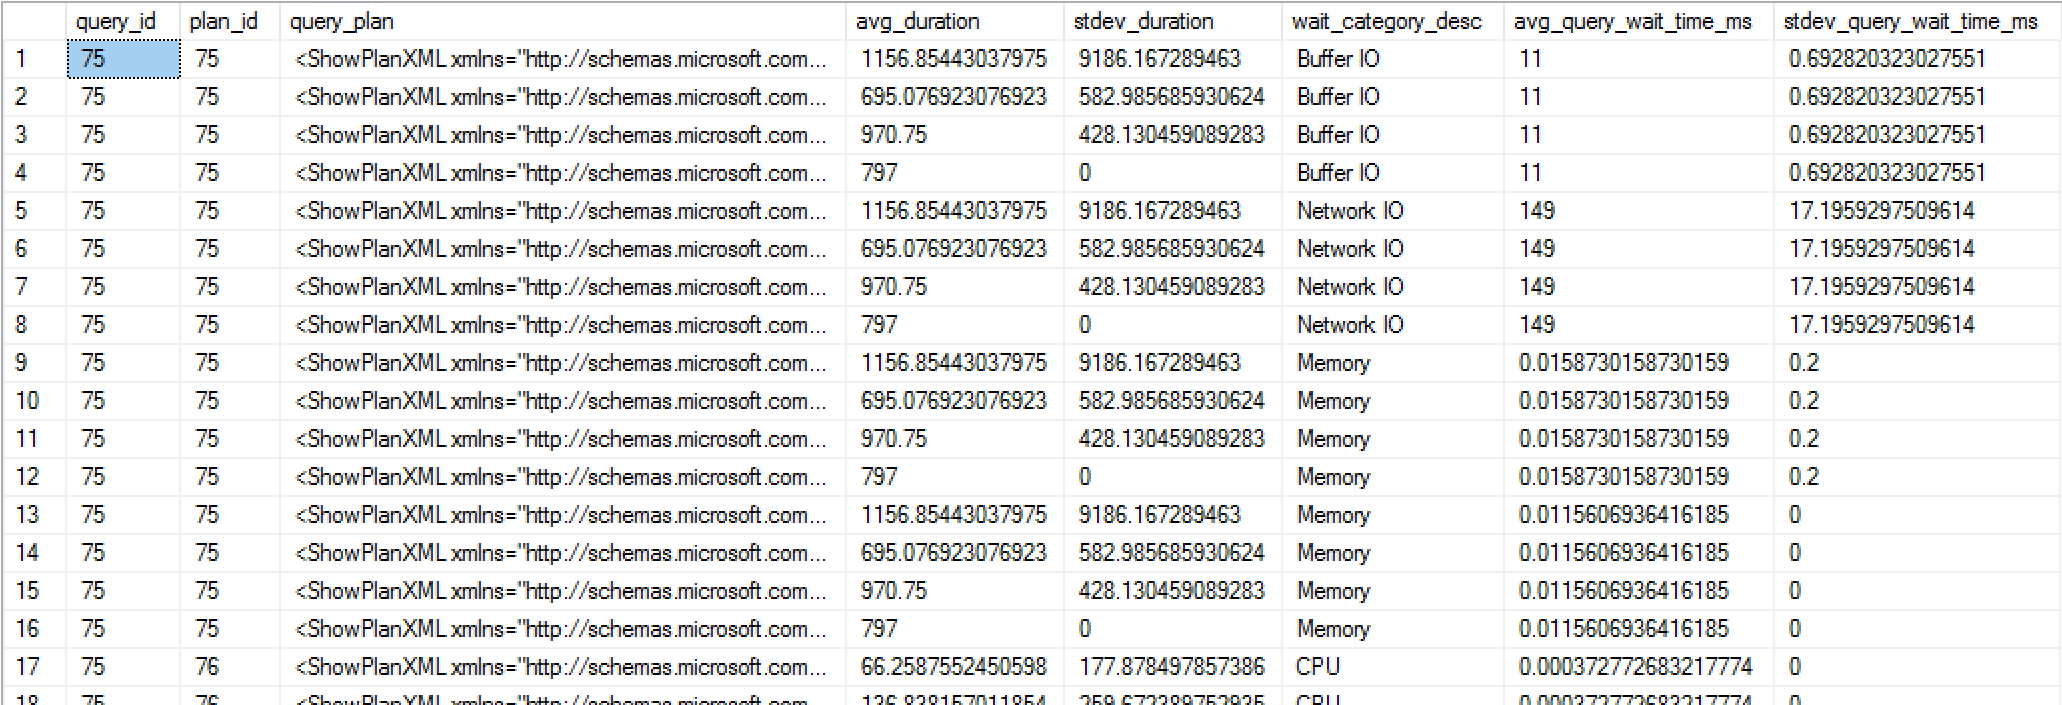
What the heck is that mess? Well, it's a combination of several things. First, you can have more than one wait type for a given time interval. Second, in the query, we're (correctly) joining the waits and the runtime stats to the plan. However, that means that they're not in any way related to each other, so we get a sort of Cartesian product out of the whole thing. If you read the documentation, it talks about aggregating by plan_id (of course), stats_interval_id, execution_type , and the wait_category. Same thing if you read the docs on sys.query_store_runtime_stats — it groups by plan_id, stats_interfal_id, and execution_type.
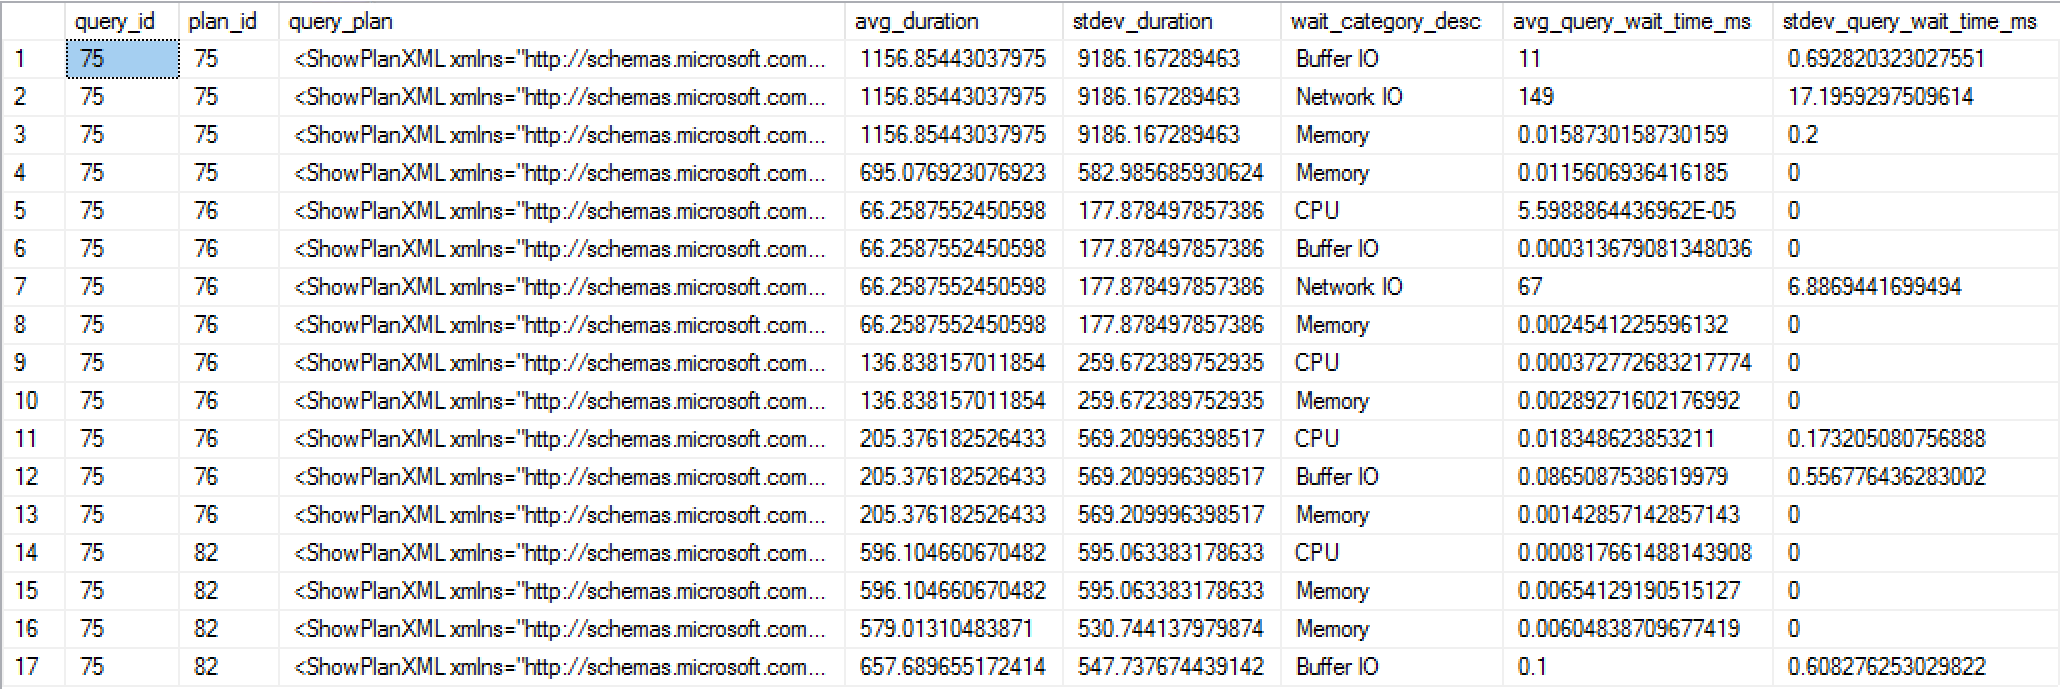
Therefore, if you're trying to combine a specific wait or set of waits (there can be multiple) with a specific set of runtime metrics, you need to modify your query to this:
SELECT qsq.query_id,
       qsp.plan_id,
       qsp.query_plan,
       qsrs.avg_duration,
       qsrs.stdev_duration,
       qsws.wait_category_desc,
       qsws.avg_query_wait_time_ms,
       qsws.stdev_query_wait_time_ms
FROM sys.query_store_query AS qsq
    JOIN sys.query_store_plan AS qsp
        ON qsp.query_id = qsq.query_id
    JOIN sys.query_store_runtime_stats AS qsrs
        ON qsrs.plan_id = qsp.plan_id
    JOIN sys.query_store_wait_stats AS qsws
        ON qsws.plan_id = qsrs.plan_id
        AND qsws.execution_type = qsrs.execution_type
        AND qsws.runtime_stats_interval_id = qsrs.runtime_stats_interval_id
WHERE qsq.object_id = OBJECT_ID('dbo.ProductTransactionHistoryByReference');
Joining query_store_runtime_stats and query_store_wait_stats ensures that you're comparing appropriate data. The first query returned 77 rows. This one returns just 17 because the wait statistics and the runtime statists are now synchronized:
Conclusion
The bad news is, this is SQL Server 2017 and Azure SQL Database only. If you're on 2016, you can cross your fingers and hope for the addition in a CU or SP. However, now, we can also see wait statistics along with our runtime statistics and the query plans inside of Query Store.
Published at DZone with permission of Grant Fritchey. See the original article here.
Opinions expressed by DZone contributors are their own.
Comments