How We Reduced LCP by 75% in a Production React App
We had a production React app with major performance issues, but a rewrite wasn't practical. This article illustrates the ways we made it better.
Join the DZone community and get the full member experience.
Join For FreeWe recently launched a brand new customer-facing React application when we started receiving customer complaints. Pages were loading slowly and users were frustrated. Customers were churning. As we dug into our internal metrics, it became clear that things were even worse than we realized. Our app fell in the bottom five of 27 apps for our organization. Our performance metrics reflected the same story. Our LCP for the 75th percentile was 7.7 seconds. Most users were staring at a loading screen for multiple seconds before they could interact with a page.
What is LCP (Largest Contentful Paint) ?
Largest Contentful Paint (LCP) is a Core Web Vitals metric that measures how long it takes for the main content of a page to become visible to the user. By this, it signifies the time that users assume that the page has fully loaded.
For most pages, the LCP element is typically one of the following:
- A large image or hero banner
- A video poster image
- A large block of text
- A prominent product image
LCP is especially important because it focuses on perceived load time, not just when the page technically finishes loading.
According to Core Web Vitals guidance:
- Good: ≤ 2.5 seconds
- Needs Improvement: 2.5–4.0 seconds
- Poor: > 4.0 seconds
How to measure LCP using Chrome Lighthouse
- Launch the page in Google Chrome
- Open DevTools (Cmd + Option + I on macOS or Ctrl + Shift + I on Windows)
- Navigate to the Lighthouse tab
- Select Performance and run the audit
After the report was created, Lighthouse showcased the Largest Contentful Paint metric with the individual element triggering LCP. Thus, it easily detectable that the LCP was triggered by either a big image, a text block, or a delayed rendering caused by JavaScript or network requests. Lighthouse was used as the main tool to find bottlenecks and locally test the corrections, the final assessment though was through the 75th percentile LCP data from actual users.
LCP of Amazon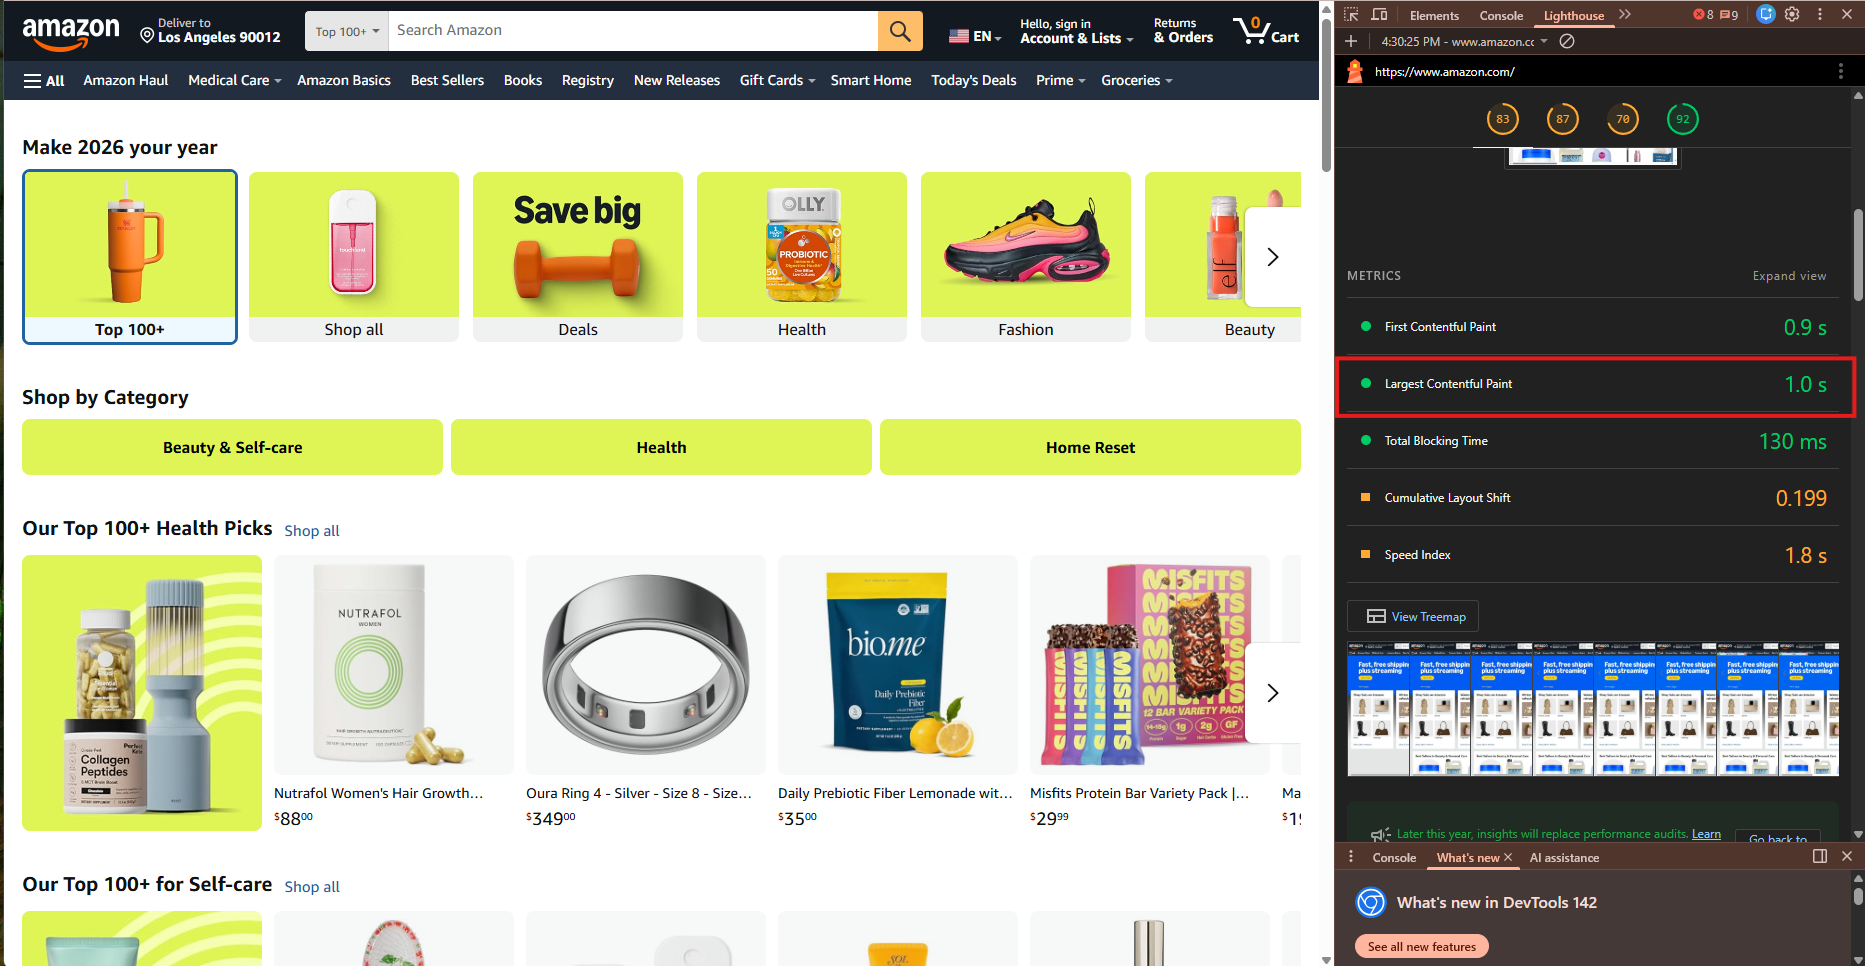
The Reason We Didn't Detect the LCP Problem in Non-Production Environments
The central issue that was raised frequently during the inquiry was that why wasn't the performance issue apparent before the application got to production.
The main reason is that our non-production environments did not copy the real-life situation.
In the case of staging, we tested it with a fixed, limited dataset that was already in cache and had newer data. Besides, all third-party integrations were directed to the sandbox environments which always returned cached responses. Hence, the network latency and cold-start behavior were partly invisible.
Right away, our 75th percentile LCP in staging was approximately ~3.2 seconds, which was actually felt as acceptable for a first release, and no one even considered it a critical aspect. Conversely, in production, the situation was drastically different: larger datasets, uncached requests, and slower third-party responses all went directly into the critical rendering path.
What We Tried First and Why It Didn't Help
1. Memoizing React Components
Our first reaction was to make the optimizations at the level of React components. We introduced React.memo, useMemo, and useCallback in multiple components that were having high re-rendering.
Example using React.memo
This prevents re-renders when props do not change.
type VehicleCardProps = {
  vehicle: Vehicle;
  onSelect: (id: string) => void;
};

const VehicleCard = ({ vehicle, onSelect }: VehicleCardProps) => {
  return (
    <div>
      <img src={vehicle.imageUrl} alt={vehicle.name} />
      <h3>{vehicle.name}</h3>
      <button onClick={() => onSelect(vehicle.id)}>
        Select
      </button>
    </div>
  );
};

export default React.memo(VehicleCard);
Example using useMemo
This avoids recomputing expensive calculations on every render.
const formattedPrice = useMemo(() => {
  return formatCurrency(vehicle.price);
}, [vehicle.price]);
Example using useCallback
This ensure function only gets reinitialized when props changes.
const handleSelect = useCallback(
  (id: string) => {
    setSelectedVehicleId(id);
  },
  []
);
Why This Didn’t Improve LCP Much
- LCP was mainly affected by network, bundle size, and image loading, not React re-renders.
- Memoization was CPU work after load but not the initial render
Takeaways
Component memoization is definitely advantageous, yet it won't repair LCP issues which are caused by oversized bundles or sluggish network requests.
2. Lazy Loading UI Components
Next, we tried lazy-loading parts of the UI using React.lazy and Suspense.
const HeavyComponent = React.lazy(() => import('./HeavyComponent'));Why This Didn’t help much
- The main content's rendering was only possible through the use of all the vital UI components
- We were unable to present any meaningful content until the complete loading of all components
Takeaways
Lazy loading facilitates only when non-critical UI can be postponed. If all items are initially needed, it will not lessen LCP.
What Actually Worked
1. Shrinking Bundle Size with Tree Shaking
After conducting a bundle analysis, we stumbled upon surprising results.
// webpack.config.js
const { BundleAnalyzerPlugin } = require('webpack-bundle-analyzer');

plugins: [
  new BundleAnalyzerPlugin()
]
A few libraries, in particular, were taking up a big part of the bundle even if we were using only a couple of their functions. The most significant contributor was lodash.
What we did to fix
- We replaced full imports with scoped imports
// replaced this
import _ from 'lodash';
// to this
import debounce from 'lodash/debounce';- In a few cases, we configured dependencies to be installed with a lighter option
- Adjusted the Webpack configuration to guarantee the right tree shaking
Result
LCP improved by around ~1.2 seconds.
Takeaways
Bundle size is more important than component-level optimizations for LCP.
2. Image Optimization and Smarter Loading
Our application is selling cars online which means we have to show lot of vehicle images and these images were coming from third party service.
What we discovered
- Images were much higher resolution than needed
- File sizes were unnecessarily large and was in .png format
- All images were loading eagerly
What we did to fix
1. Converted images to WebP format using sharp npm module
import sharp from 'sharp';

sharp(inputBuffer)
  .resize(800)
  .toFormat('webp')
  .toBuffer();
2. Served responsive image sizes based on rendering screen size
<img
  src="car-800.webp"
  srcset="car-400.webp 400w, car-800.webp 800w"
  sizes="(max-width: 600px) 400px, 800px"
  loading="lazy"
/>
3. Lazy-loaded images in carousels
- Load only the first few visible images
- Load the next set as the user continues scrolling or sliding
Result
LCP improved by around ~1 seconds.
Takeaways
Image optimization is one of the highest ROI LCP improvements.
3. Getting Rid of Sequential API Calls
We diligently tracked the API calls made at the time the webpage is loaded initially and found a chain of requests that are sequential:
API A → API B → API C → API D
Every request required the preceding reply, which finally resulted in:
- Multiple rounds of network trips.
- Repeated authentication checks
- Multiple database reads
Dependency was the reason parallelizing was impossible.
What we did to fix:
We amalgamated the logic of sequential api's under one backend workflow API.
// Instead of multiple calls from frontend
GET /api/workflow/initial-data
This api:
- Coordinated service calls behind the scenes
- Combined business logic
- Delivered a single aggregated response back to the frontend
Result
LCP improved by around ~1.4 seconds.
Additional Advantages
- Less frequently database reads
- Light auth server load
- Easier frontend logic to understand
4. Caching the Responses of Third-party APIs that are Slow
A third-party API frequently used for pricing was constantly slow and would generally take 2-3 seconds for every request.
What we did to fix:
- We had to cache it on the server side through Redis
// Pseudo-code
if (cache.exists(key)) {
  return cache.get(key);
}

const response = await thirdPartyApi.fetch();
cache.set(key, response, TTL);
- We created a job that would run at night to delete the data that will soon be expired
// Nightly job
cron.schedule('0 0 * * *', refreshExpiringCache);
Result
LCP improved by around ~2-3 seconds.
Takeaways
When slow third-party APIs are crucial for your project, caching is a must-have.
Key Learnings
LCP isn't merely a metric of frontend rendering; it also indicates the total effect of JavaScript, APIs, images, and backend performance altogether. Thus, the advancements had to entail adjustments in both frontend and backend systems.
Opinions expressed by DZone contributors are their own.
Comments