Server Monitoring With Logz.io and the ELK Stack
Learn more about server monitoring with Logz.io and the ELK stack.
Join the DZone community and get the full member experience.
Join For FreeIn a previous article, we explained the importance of monitoring the performance of your servers. Keeping tabs on metrics such as CPU, memory, disk usage, uptime, network traffic, and swap usage will help you gauge the general health of your environment as well as provide the context you need to troubleshoot and solve production issues.
In the past, command line tools, such as top, htop, or nstat, might have been enough, but in today’s modern IT environments, a more centralized approach for monitoring must be implemented.
There are a variety of open-source daemons that can be used for monitoring servers, such as StatsD and collectd, but these only handle the process of collection. These need to be complemented by solutions that can store the metrics and provide the tools to analyze them. That’s where the ELK stack comes into the picture — providing a complete platform for collecting, storing, and analyzing server metrics.
In this article, we’ll explain how to use both Logz.io and vanilla ELK to ship server metrics using Metricbeat. We’ll look into how to set up the pipeline and build a monitoring dashboard in Kibana (to follow the steps described below, you’ll need either a Logz.io account or your own ELK Stack setup).
What Is Metricbeat?
As its name implies, Metricbeat collects a variety of metrics from your server (i.e. operating system and services) and ships them to an output destination of your choice. These destinations can be ELK components such as Elasticsearch or Logstash, or other data processing platforms such as Redis or Kafka.
Metricbeat is installed on the different servers in your environment and used for monitoring their performance, as well as that of different external services running on them. For example, you can use Metricbeat to monitor and analyze system CPU, memory and load. In Dockerized environments, Metricbeat can be installed on a host for monitoring container performance metrics.
Installing Metricbeat
There are various ways of installing Metricbeat, but for the sake of this article, we’ll be installing it from Elastic’s repositories.
First, we’ll download and install Elastic’s public signing key:
wget -qO - https://artifacts.elastic.co/GPG-KEY-elasticsearch | sudo apt-key
add -
Next, we’ll save the repository definition to ‘/etc/apt/sources.list.d/elastic-6.x.list’:
echo "deb https://artifacts.elastic.co/packages/6.x/apt stable main" | sudo
tee -a /etc/apt/sources.list.d/elastic-6.x.list
We’ll update the system and install Metricbeat with:
sudo apt-get update && sudo apt-get install metricbeatConfiguring Metricbeat
As mentioned above, Metricbeat can track metrics for different applications installed on our servers as well as the host machine itself.
These configurations are applied using modules. You can see a list of the enabled and disabled modules in /etc/metricbeat/modules.d:
ls /etc/metricbeat/modules.d/

12                          haproxy.yml.disabled     nginx.yml.disabled
aerospike.yml.disabled      http.yml.disabled        php_fpm.yml.disabled
apache.yml.disabled         jolokia.yml.disabled     postgresql.yml.disabled
ceph.yml.disabled           kafka.yml.disabled       prometheus.yml.disabled
couchbase.yml.disabled      kibana.yml.disabled      rabbitmq.yml.disabled
docker.yml.disabled         kubernetes.yml.disabled  redis.yml.disabled
dropwizard.yml.disabled     kvm.yml.disabled         system.yml
elasticsearch.yml.disabled  logstash.yml.disabled    traefik.yml.disabled
envoyproxy.yml.disabled     memcached.yml.disabled   uwsgi.yml.disabled
etcd.yml.disabled           mongodb.yml.disabled     vsphere.yml.disabled
golang.yml.disabled         munin.yml.disabled       windows.yml.disabled
graphite.yml.disabled       mysql.yml.disabled       zookeeper.yml.disabled
Within each module, different metricsets can be used to ship different sets of metrics. In the case of the system module, the default metricsets are CPU, load, memory, network, process, and process_summary.
To ship additional metricsets, such as socket or uptime, simply edit the system module and specify the desired metricsets you want to ship:
sudo vim /etc/metricbeat/modules.d/system.yml

- module: system
  period: 10s
  metricsets:
    - cpu
    - load
    - memory
    - network
    - process
    - process_summary
    - core
    - diskio
    - socket

enabled: true
  period: 10s
  processes: ['.*']
Save the file.
The only other configuration that you need to worry about at this stage is where to ship the metrics to. This is done in the Metricbeat configuration file at:
/etc/metricbeat/metricbeat.yml.Shipping to ELK
Since I’m using a locally installed Elasticsearch, the default configurations will do me just fine. If you’re using a remotely installed Elasticsearch, make sure you update the IP address and port.
output.elasticsearch:
  hosts: ["localhost:9200"]
If you’d like to output to another destination, that’s fine. You can ship to multiple destinations or comment out the Elasticsearch output configuration to add an alternative output. One such option is Logstash, which can be used to execute additional manipulations on the data and as a buffering layer in front of Elasticsearch.
When done, simply start Metricbeat with:
sudo service metricbeat startTo verify all is running as expected, query Elasticsearch for created indices:
sudo curl http://localhost:9200/_cat/indices?v
health status index uuid pri rep docs.count docs.deleted store.size pri.store.size
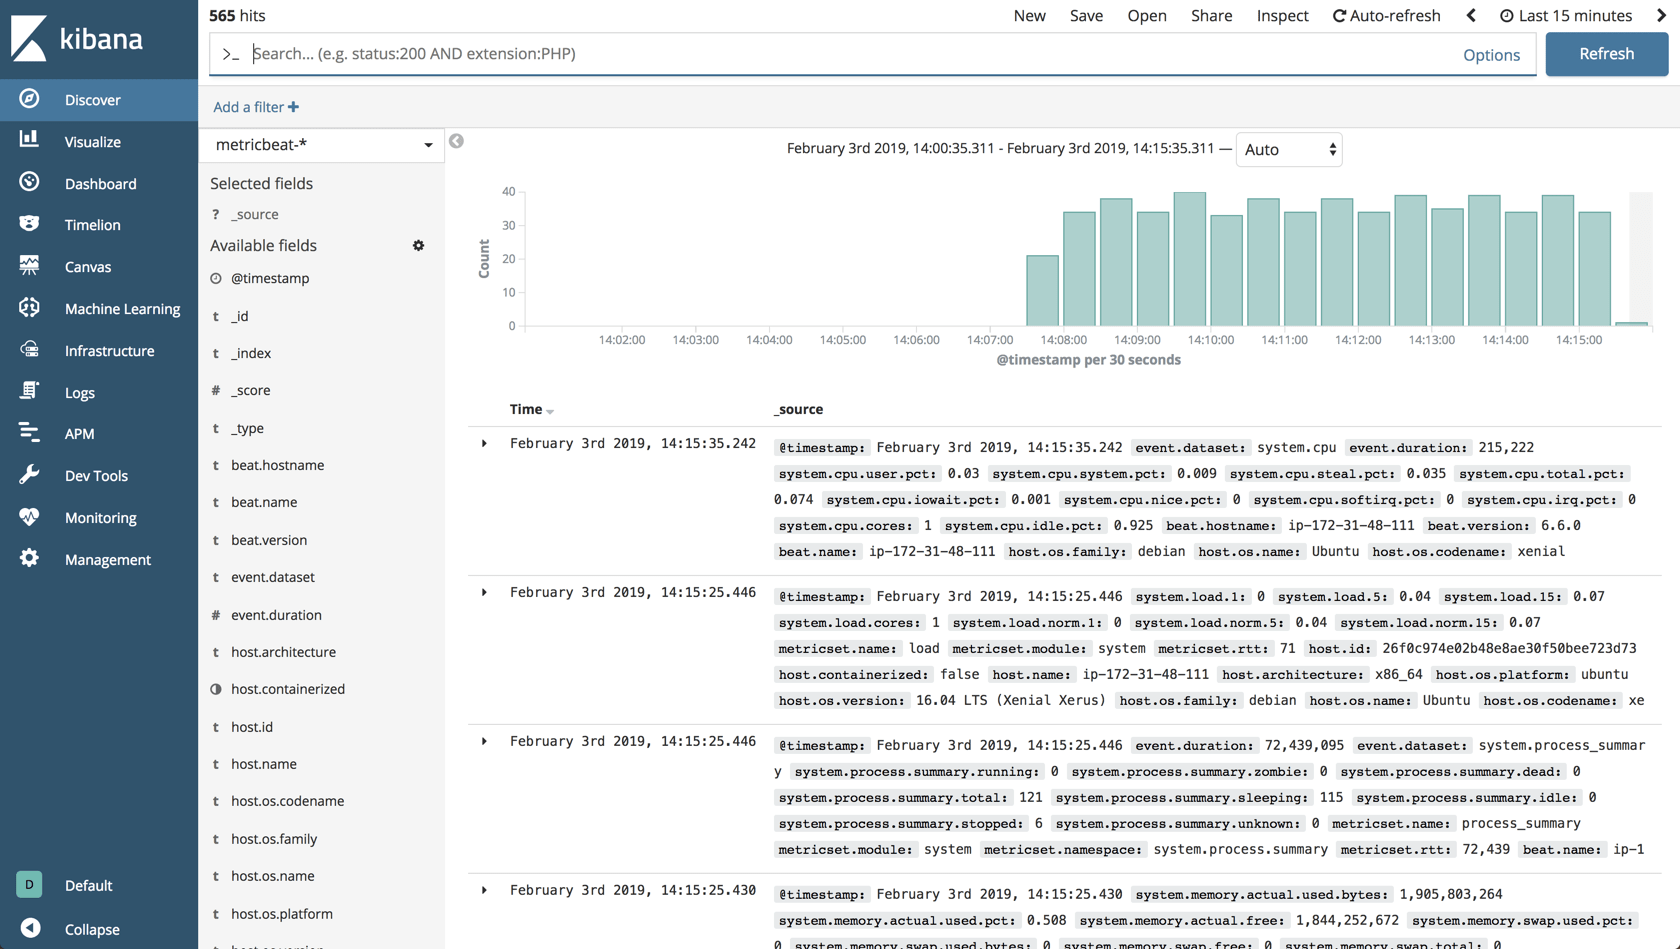
yellow open metricbeat-2019.02.04 gdQIYsr9QRaAw3oJQGgVTA 5 1 924 Define the index pattern in Kibana: Management → Index Patterns → Create Index Pattern, and you’ll begin to see the data on the Discover page:
Shipping to Logz.io
To ship metrics to Logz.io, there are a few tweaks that need to be made to the Metricbeat configuration file.
First, download an SSL certificate for encryption:
wget https://raw.githubusercontent.com/logzio/public-certificates/master/COMODORSADomainValidationSecureServerCA.crt

sudo mkdir -p /etc/pki/tls/certs

sudo cp COMODORSADomainValidationSecureServerCA.crt /etc/pki/tls/certs/
Next, add the following configuration to the Metricbeat configuration file:
sudo vim /etc/metricbeat/metricbeat.ymlComment out the Elasticsearch output, and enter the following configurations:
fields:
  env: dev
  logzio_codec: json
  token: <yourLogzioToken>
  type: metricbeat
fields_under_root: true
ignore_older: 3hr
encoding: utf-8

output.logstash:
  hosts: ["listener.logz.io:5015"]
  ssl:
      certificate_authorities: ['/etc/pki/tls/certs/COMODORSADomainValidationSecureServerCA.crt']
Be sure to enter your Logz.io account token in the relevant field. You can find your token in the Logz.io UI, on the General page of your settings.
Save the configuration file and start Filebeat:
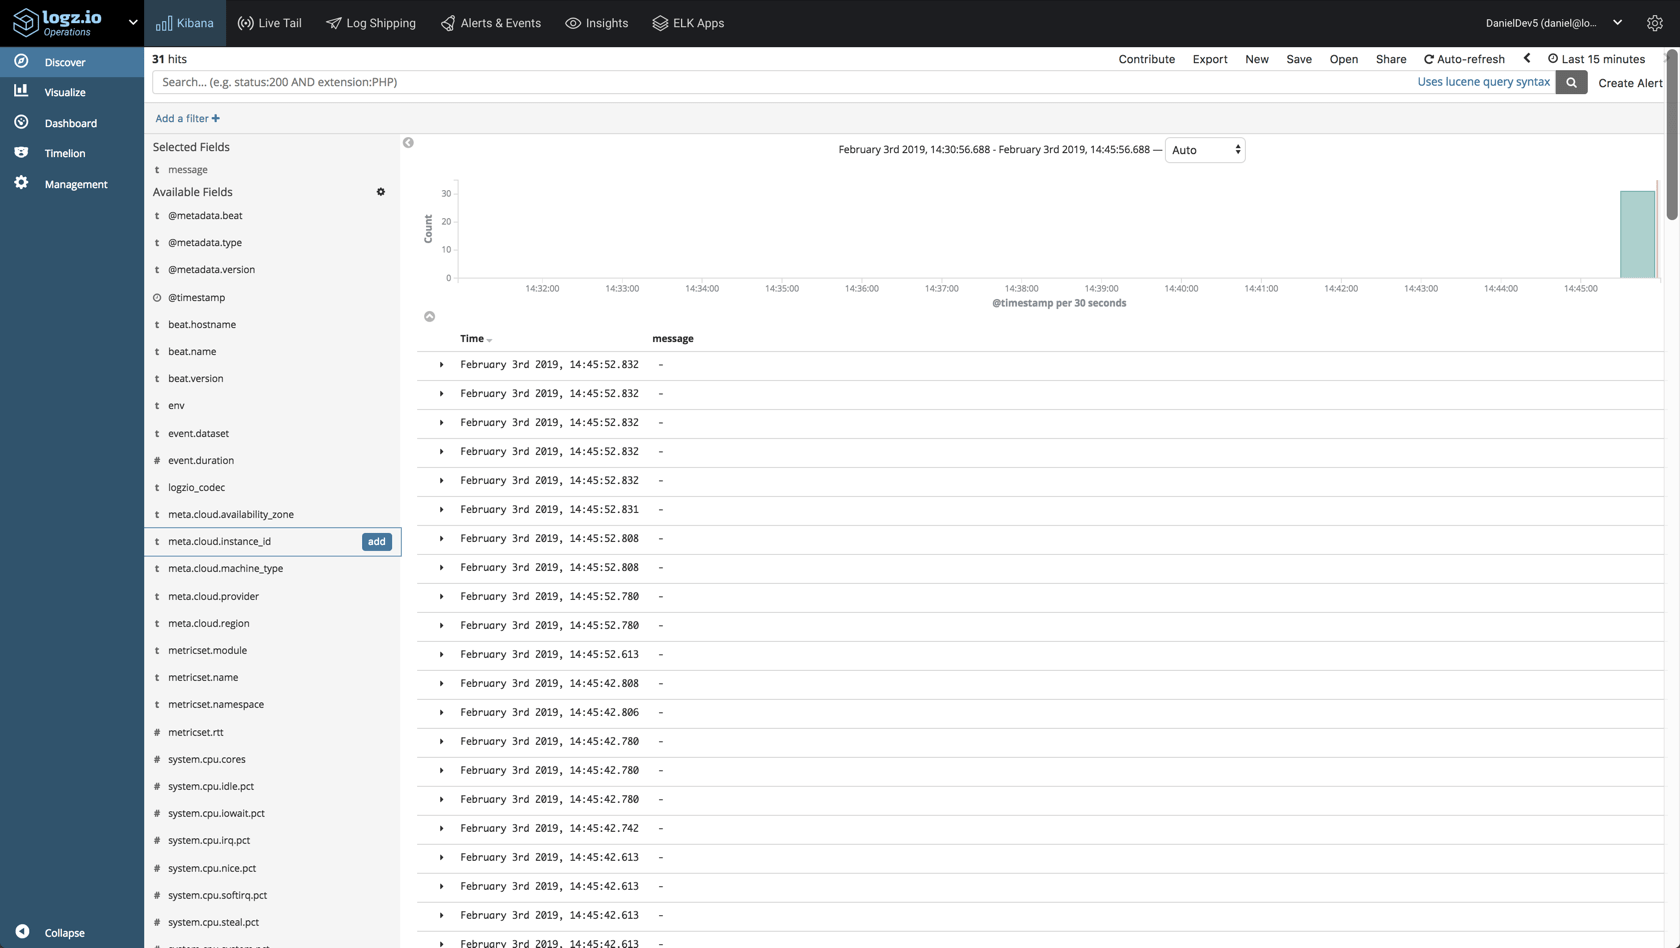
sudo service metricbeat startWait a minute or two, and you will begin to see your server metrics data in Logz.io:
Analyzing the Data in Kibana
Collecting the data is straightforward enough. In a multi-host environment, you will, of course, need to repeat the process above per server. The next step is to understand how to analyze and visualize the data and extract some insight from it.
Metricbeat records a large number of metrics, and Kibana provides the tools to build some nifty visualizations to monitor them. Below are some examples of visualizations you can build based on these metrics.
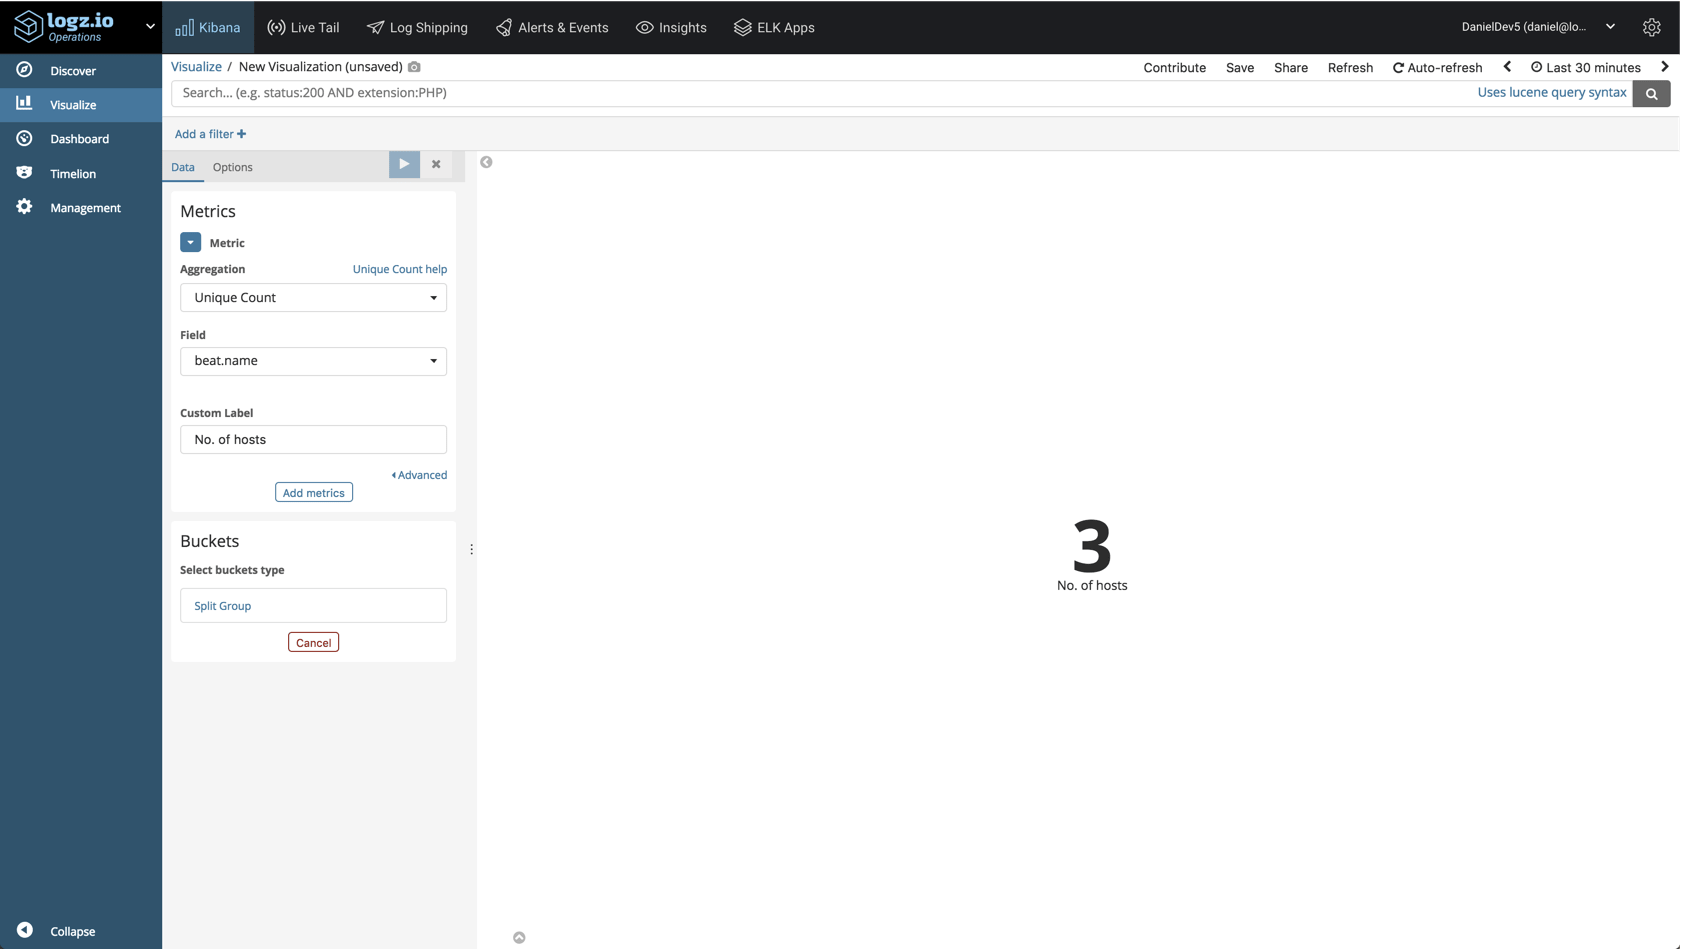
No. of Hosts
Let’s start with the basics. A metric visualization using a unique count aggregation of the host.beatname field will give us the number of hosts you are monitoring:
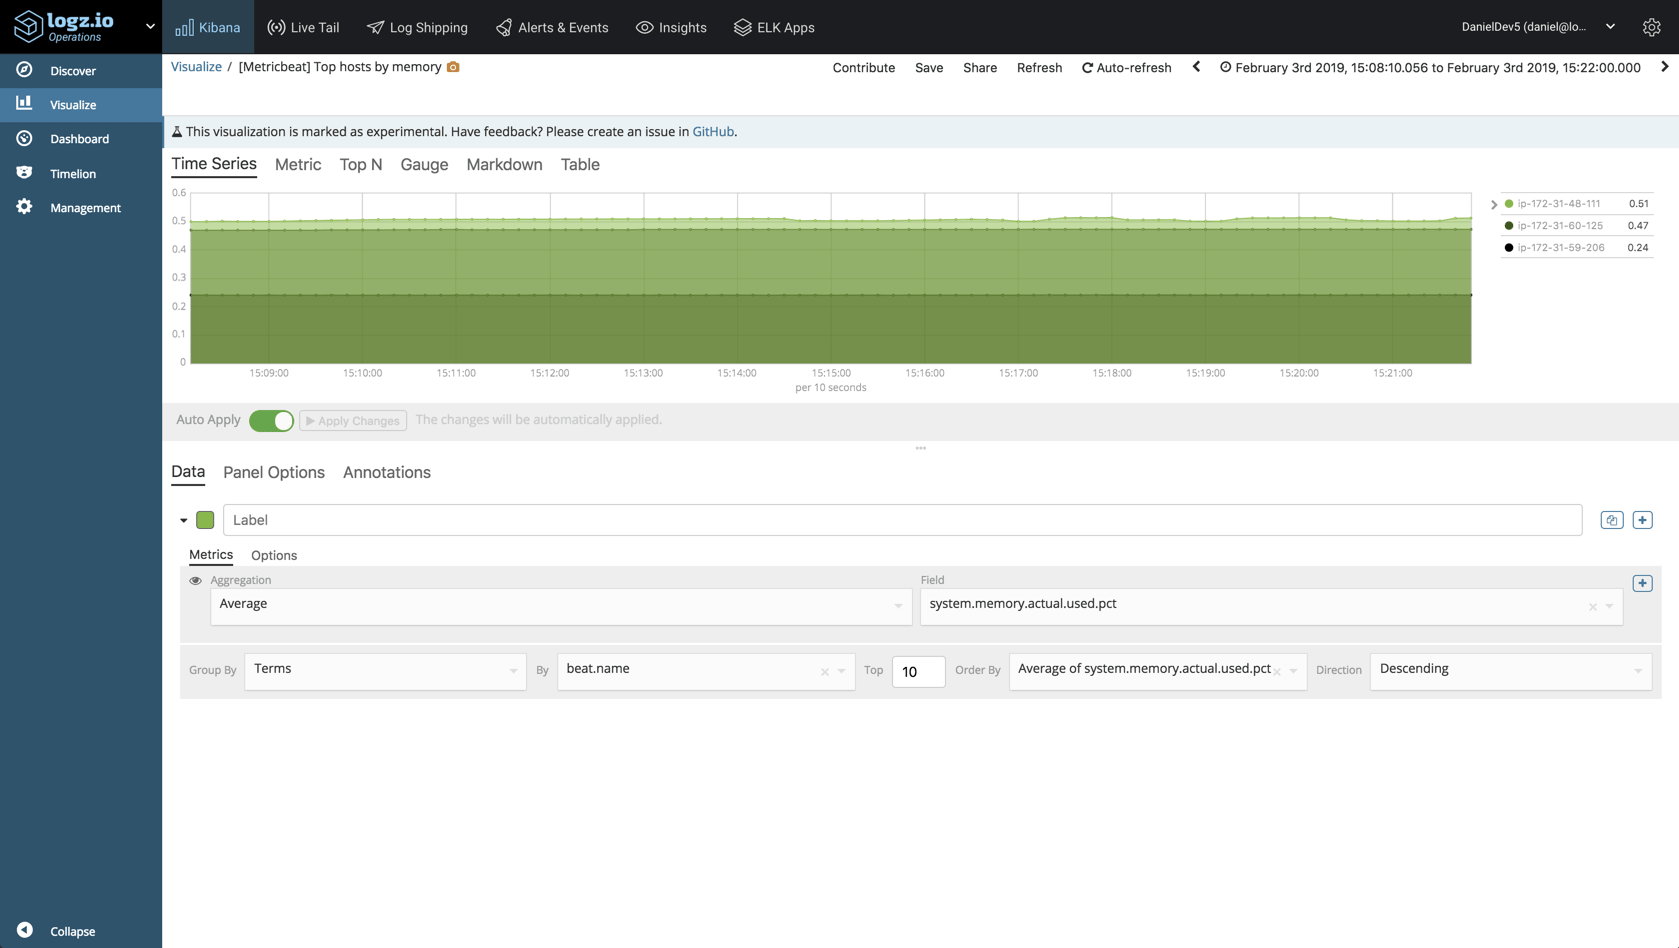
Memory Used Per Host
A more advanced visualization will help us monitor the amount of memory used per host. To build this visualization, we will use Visual Builder, Kibana’s Grafana-like visualization tool.
We will use a simple average of the system.memory.actual.used.pct field:
System Load
We can compare various metrics as well. In the example below, we are using Visual Builder again — this time to compare system load, 1m, 5m, and 15m:
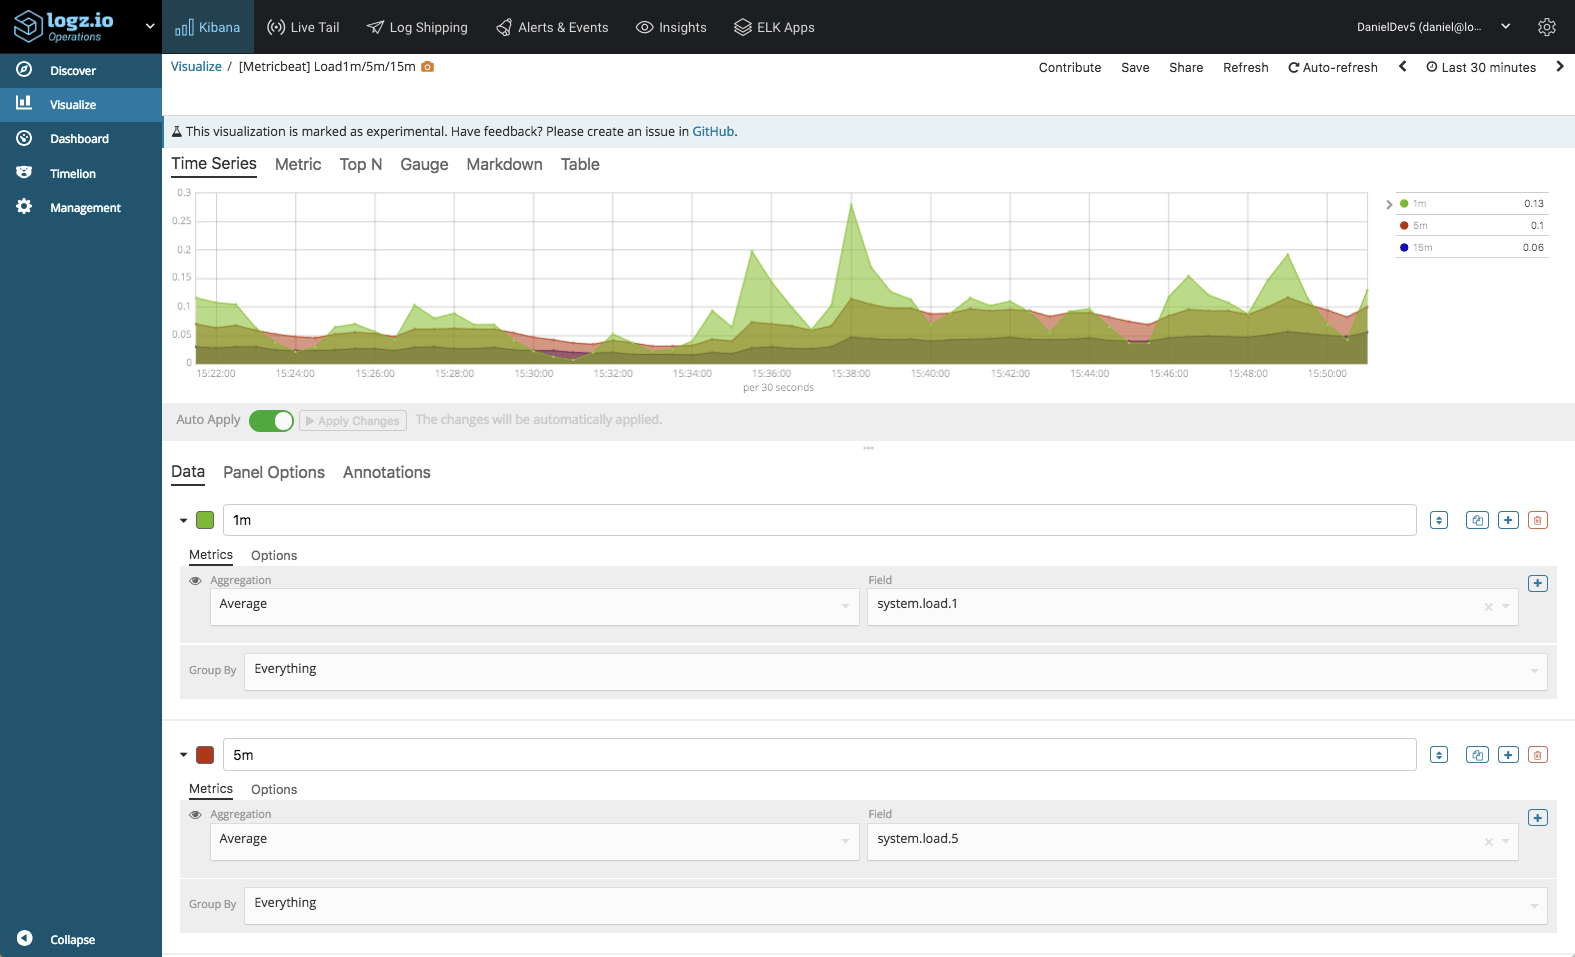
And the examples go on. There really is no limit to how you can slice and dice the data in Kibana, and the best way is to experiment. Once you have all your visualizations ready, simply add them into one dashboard.
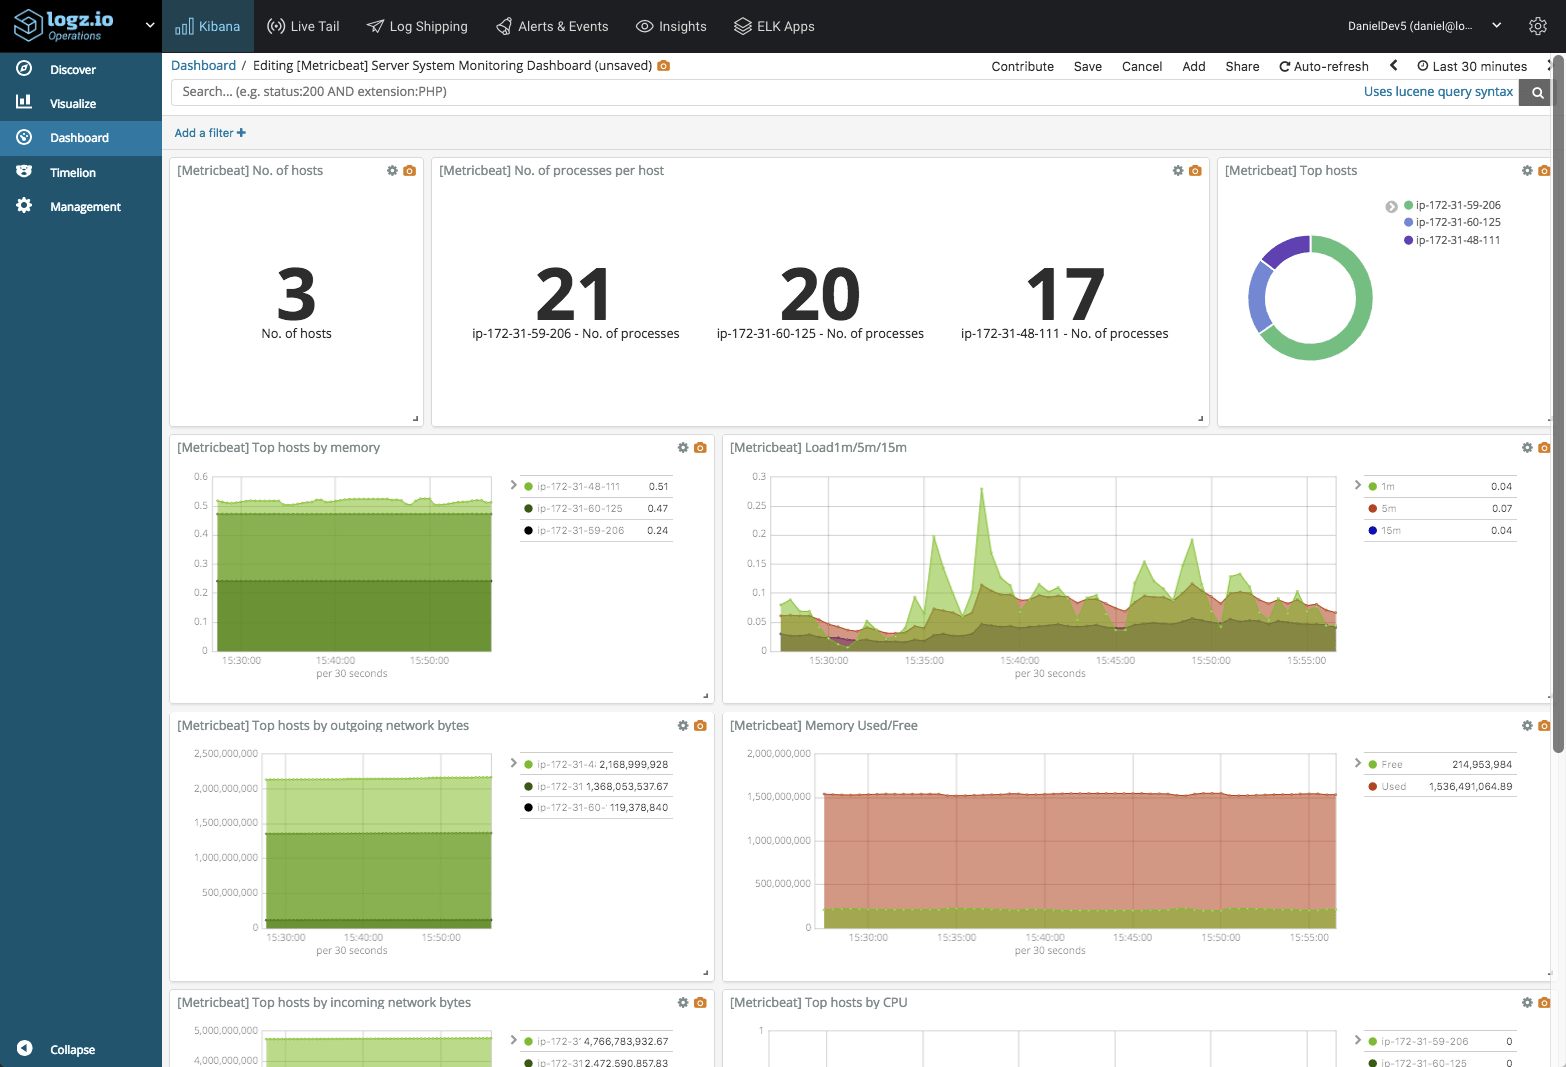
This dashboard is available in ELK Apps — Logz.io’s library of Kibana searches, alerts, visualizations, and dashboards, together with other Metricbeat dashboards. Simply search for “Metricbeat” and install any of the listed dashboards in one click.
Monitoring Does Not End With a Dashboard
To be a bit more proactive in your monitoring, you will want to be notified when something out of the ordinary is taking place. If you’re using your own ELK deployment, you will need to add an alerting module to the stack — ElastAlert for example. If you’re a Logz.io user, you can use the built-in alerting mechanism to get alerted via Slack, PagerDuty, or any other endpoint you may have configured in the system.
Endnotes
We only touched upon one type of metrics that Metricbeat supports, but in reality, you will be collecting metrics from a much larger infrastructure and different types of servers. Whether MySQL, Apache, Kubernetes or Kafka — Metricbeat supports the collection and forwarding of a vast array of server metrics which can be used to gauge the general health of your environment.
You will most likely want to use a configuration management or automation system of sorts to simplify the process of deploying Metricbeat. You could use Ansible or Terraform, for example, but in either case, Metricbeat itself is extremely easy to configure.
To sum it up, while the ELK Stack is first and foremost a log management system, changes being made to both Elasticsearch on the backend and Kibana on the frontend, as well as the shipping agents used to collect and forward the data, are making the stack a compelling solution for metrics as well.
Published at DZone with permission of Daniel Berman. See the original article here.
Opinions expressed by DZone contributors are their own.
Comments