DZone
Thanks for visiting DZone today,
Edit Profile
  • Manage Email Subscriptions
  • How to Post to DZone
  • Article Submission Guidelines
Sign Out View Profile
  • Post an Article
  • Manage My Drafts
Over 2 million developers have joined DZone.
Log In / Join
Please enter at least three characters to search
Refcards Trend Reports
Events Video Library
Refcards
Trend Reports

Events

View Events Video Library

Zones

Culture and Methodologies Agile Career Development Methodologies Team Management
Data Engineering AI/ML Big Data Data Databases IoT
Software Design and Architecture Cloud Architecture Containers Integration Microservices Performance Security
Coding Frameworks Java JavaScript Languages Tools
Testing, Deployment, and Maintenance Deployment DevOps and CI/CD Maintenance Monitoring and Observability Testing, Tools, and Frameworks
Culture and Methodologies
Agile Career Development Methodologies Team Management
Data Engineering
AI/ML Big Data Data Databases IoT
Software Design and Architecture
Cloud Architecture Containers Integration Microservices Performance Security
Coding
Frameworks Java JavaScript Languages Tools
Testing, Deployment, and Maintenance
Deployment DevOps and CI/CD Maintenance Monitoring and Observability Testing, Tools, and Frameworks

Because the DevOps movement has redefined engineering responsibilities, SREs now have to become stewards of observability strategy.

Apache Cassandra combines the benefits of major NoSQL databases to support data management needs not covered by traditional RDBMS vendors.

The software you build is only as secure as the code that powers it. Learn how malicious code creeps into your software supply chain.

Generative AI has transformed nearly every industry. How can you leverage GenAI to improve your productivity and efficiency?

Related

  • Different CPU Times: Unix/Linux ‘top’
  • Software Delivery at Scale: Centralized Jenkins Pipeline for Optimal Efficiency
  • Optimizing Software Performance for High-Impact Asset Management Systems
  • Beyond Code Coverage: A Risk-Driven Revolution in Software Testing With Machine Learning

Trending

  • MCP Servers: The Technical Debt That Is Coming
  • The Future of Java and AI: Coding in 2025
  • Tired of Spring Overhead? Try Dropwizard for Your Next Java Microservice
  • Monolith: The Good, The Bad and The Ugly
  1. DZone
  2. Software Design and Architecture
  3. Performance
  4. Software Interrupt Time – ‘si’ Time in top

Software Interrupt Time – ‘si’ Time in top

Pardon the interruption...

By 
Ram Lakshmanan user avatar
Ram Lakshmanan
DZone Core CORE ·
Feb. 08, 21 · Tutorial
Likes (2)
Comment
Save
Tweet
Share
5.8K Views

Join the DZone community and get the full member experience.

Join For Free

CPU consumption in Unix/Linux operating systems is studied using eight different metrics: User CPU time, System CPU time, nice CPU time, Idle CPU time, Waiting CPU time, Hardware Interrupt CPU time, Software Interrupt CPU time, Stolen CPU time. In this article let's study ‘Software Interrupt CPU time’.

What Is Software Interrupt CPU Time?

To understand the ‘software interrupt time’, one must understand ‘software interrupts’ first. Software interrupts can be triggered because of the following events:

  • When software run into exceptional conditions such as a divide by zero or accessing unavailable memory.
  • When a special instruction in the application code causes an interrupt when the processor executes it.
  • Some hardware interrupts might take a long time to complete. In such scenarios, hardware interrupts can be deferred to execute at a later point of time through software interrupts. Software interrupts can be scheduled to run independently or on any CPU in the device or even run concurrently. On the other hand, these flexibilities don’t exist in hardware interrupts.

The amount of time the CPU spends in processing these software interrupt signals is called ‘Software interrupt time’. 

How to Find the Software Interrupt CPU Time

 Software interrupt CPU time can be found from the following sources:

  • You can use web-based root cause analysis tools to report ‘software interrupt’ CPU time. Tool is capable of generating alerts if ‘software interrupt’ CPU time goes beyond the threshold.
  • ‘software interrupt’ CPU time is also reported in the Unix/Linux command line tool ‘top’ in the field ‘si’ as highlighted in the below image.

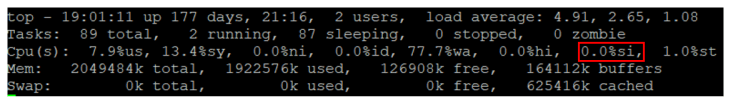
Fig: software interrupt ‘si’ time in top

How to Resolve a High Software Interrupt CPU Time

  1. Try rebooting the device.
  2. Make sure you are running on the latest OS version with all patches installed.
Software CPU time

Opinions expressed by DZone contributors are their own.

Related

  • Different CPU Times: Unix/Linux ‘top’
  • Software Delivery at Scale: Centralized Jenkins Pipeline for Optimal Efficiency
  • Optimizing Software Performance for High-Impact Asset Management Systems
  • Beyond Code Coverage: A Risk-Driven Revolution in Software Testing With Machine Learning

Partner Resources

×

Comments
Oops! Something Went Wrong

The likes didn't load as expected. Please refresh the page and try again.

ABOUT US

  • About DZone
  • Support and feedback
  • Community research
  • Sitemap

ADVERTISE

  • Advertise with DZone

CONTRIBUTE ON DZONE

  • Article Submission Guidelines
  • Become a Contributor
  • Core Program
  • Visit the Writers' Zone

LEGAL

  • Terms of Service
  • Privacy Policy

CONTACT US

  • 3343 Perimeter Hill Drive
  • Suite 100
  • Nashville, TN 37211
  • support@dzone.com

Let's be friends:

Likes
There are no likes...yet! 👀
Be the first to like this post!
It looks like you're not logged in.
Sign in to see who liked this post!