Use the WinDbg Engine in Visual Studio User-Mode Debugging
Join the DZone community and get the full member experience.
Join For Freein our c++ debugging course , there are several scenarios which require windbg and cannot be completed in visual studio. they all rely on advanced extension commands available in windbg. some examples:
- tracing opened and closed handles with the !htrace command
- viewing native heap information with the !heap command
- loading and executing code in the debuggee process with the sdbgext extension commands !loaddll , !remotecall
- inspecting handles to synchronization objects with the !handle command
the sheer power of windbg built-in commands and extensions makes it a viable replacement to visual studio when doing hard-core debugging. however, the user interface – the tool windows, the source editor, setting up breakpoints, stepping through source, inspecting variables – are no match to the rich visual studio environment.
the good news is that as of visual studio 11, we’ll be able to use the windbg debugging engine (“windows debugger”) inside visual studio, combining the powerful commands with the convenient interface. just use the “windows user mode debugger” transport in the tools | attach to process dialog. this also applies to dumps – you can open dumps with the visual studio “minidump summary” dialog, or you can use the file | open crash dump menu item, the same way as for kernel dumps.

(click the screenshot to enlarge)
that’s really all there’s to it – after attaching, you have the windbg shell inside visual studio, in the debugger immediate window which we’ve already seen. the call stack, threads, locals debugger windows are fully functional, and you can combine visual analysis of the source code with running advanced extension commands in the shell.
for example, here’s a thread that is waiting for a mutex:

(click the screenshot to enlarge)
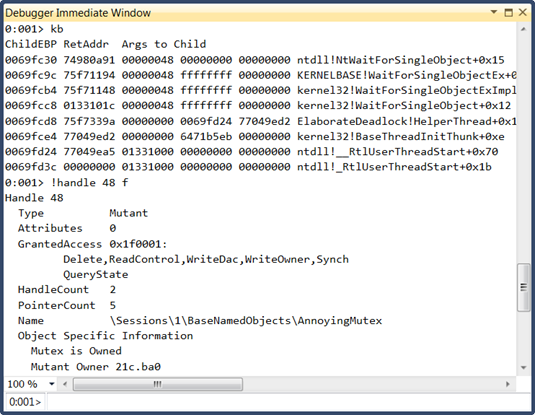
which thread owns this mutex? the !handle command comes in handy:

(click the screenshot to enlarge)
…and we’ve got the owner information.
visual studio 11 is going to change the way we’re doing crash analysis and live debugging of advanced scenarios. i bet plenty of my past and future students are going to be very happy about being able to use visual studio instead of learning the ropes of another tool, which has quite the reputation for being user-unfriendly :-)
if you’re doing any .net debugging, you’re probably wondering if this means better integration for sos in visual studio. unfortunately, right now the answer is no. with some effort – going through the visual studio tools | attach to process dialog – you can attach the windbg engine to a .net process. however, the engine does not recognize .net any better than standalone windbg, so you don’t have managed call stacks, local variables, and source code support within the ide. but if all you wanted is to run a couple of sos commands without leaving vs, you certainly can.another caveat is that currently you need to install the wdk on top of visual studio 11 to get the debugger integration. i’m guessing – or rather, hoping – that in the release version it will suffice to install debugging tools for windows.
 i have been recently posting short updates and links on twitter as well as on this blog. you can follow me:
@goldshtn
Published at DZone with permission of Sasha Goldshtein, DZone MVB. See the original article here.
Opinions expressed by DZone contributors are their own.

Comments