Utilize OpenShift to Manage External Services Metrics
Openshift 4 has great metrics monitor suites used to monitor and create dashboards for infra and application layer services; we can leverage that to manage external services and infra as well.
Join the DZone community and get the full member experience.
Join For FreeWhy
Openshift 4 provided great metrics monitor suites, we can use them to monitor and create dashboards for both infra and application layer services; What's more, we can leverage that to manage external services and infra as well.
The benefits why I want to address this issue are:
- Establish and maintaining a sophisticated monitoring solution can be very hard and time-consuming.
- The monitoring components are almost coming free with embedded in Openshift. They are managed by the Openshift Cluster Monitoring operator which is stable, self-healing, and well-structured.
- Manage and scale infra configuration like monitoring components in OpenShift is easier than doing it in VM because of its declarative nature and we can even manage them by GitOps.
- Of course, if you have both the OpenShift Platform to manage the container world and the VM world to manage other businesses, you don't have to manage two complicated Monitoring solutions for time and cost-saving.
What
In this article I'm going to cover the following topic in order to demonstrate how to monitor external services on OpenShift Monitoring Component:
- Exporting Quarkus applications via MicroProfile metrics.
- Configuring OpenShift to enable user-defined monitoring components.
- Proxy external service in Openshift via Kubernetes service.
- Create My Grafana Instance to host application dashboard for external service metrics.
- (Optional) Utilize node exporter to monitor external infra metrics.
Although the issue I am addressing is targeted to external services, you can surely apply the same steps for your applications hosted in OpenShift.
How
Exporting Quarkus Applications by Micro Profile Metrics
In this lab I'm going to use the Quarkus framework to demonstrate the application metric monitoring, the application example is a quarkus-todo-application in my GitHub repo.
Quarkus application supports 2 ways to export metrics:
- MicroProfile metrics.
- Micrometer metrics.
I'm using the MicroProfile metric.
The key part of exporting metrics in a quarkus application are:
xxxxxxxxxx
## Quarkus MicroPofile metrics How to
1. Add smallrye dependencies
```xml
<dependency>
<groupId>io.quarkus</groupId>
<artifactId>quarkus-smallrye-metrics</artifactId>
</dependency>
```
2. Add metric for your rest api method
```java
@GET
@Path("/{id}")
@Counted(name= "getOneTask", description = "How many get method being triggered.")
@Timed(name = "getOneTaskTimer", description = "How long get one task perform", unit = MetricUnits.MILLISECONDS)
public Todo getOne(@PathParam("id") Long id) { ... }
@GET
@Path("/{number}")
@Produces(MediaType.TEXT_PLAIN)
@Counted(name = "performedChecks", description = "How many primality checks have been performed.")
@Timed(name = "checksTimer", description = "A measure of how long it takes to perform the primality test.", unit = MetricUnits.MILLISECONDS)
public String checkIfPrime(@PathParam("number") long number) {...}
```
3. Configure quarkus to export metrics to /metrics
By default MicroProfile would export metrics at /q/metrics instead of **/metrics**.
Since prometheus is expecting endpint /metrics, we must explicit configure quarkus to change the metric rest path
```properties
#application.properties
quarkus.smallrye-metrics.path=/metrics
```
Build and Deploy
If you are familiar with build and dev concepts, you can directly get a binary image in my quay.io repo.
Here are the steps to deploy the Todo service on a virtual machine.
My target VM IP is
192.168.2.10 OS: rhel7
#Execute on my laptop
mvn quarkus:dev
#Test my metrics is actual exporting
curl http://localhost:8080/metrics|grep Prime
application_io_quarkus_sample_PrimeNumberChecker_checksTimer_rate_per_second gauge
application_io_quarkus_sample_PrimeNumberChecker_checksTimer_rate_per_second 9...
#Build container images and push into a remote repo, you need to change to your accessible repo
podman build -f src/main/docker/Dockerfile.ubi . -t quay.io/rzhang/quarkus:todo-app-jvm-11-nodb
# log into my target virtual machine 192.168.2.10
ssh 192.168.2.10
podman run -d --name todo-app -p 8080:8080 quay.io/rzhang/quarkus:todo-app-jvm-11-nodb
curl http://192.168.2.10:8080/metrics|grep Prime
application_io_quarkus_sample_PrimeNumberChecker_checksTimer_rate_per_second gauge
application_io_quarkus_sample_PrimeNumberChecker_checksTimer_rate_per_second 9...
OK, the application is deployed in a VM and metrics have been exported to: http://192.168.2.10:8080/metrics
Let's see how to configure OpenShift to collect these metrics.
Configuring OpenShift to Enable User-defined Monitoring Components
First, let's have a briefing on how Monitoring components are organized in OpenShift.
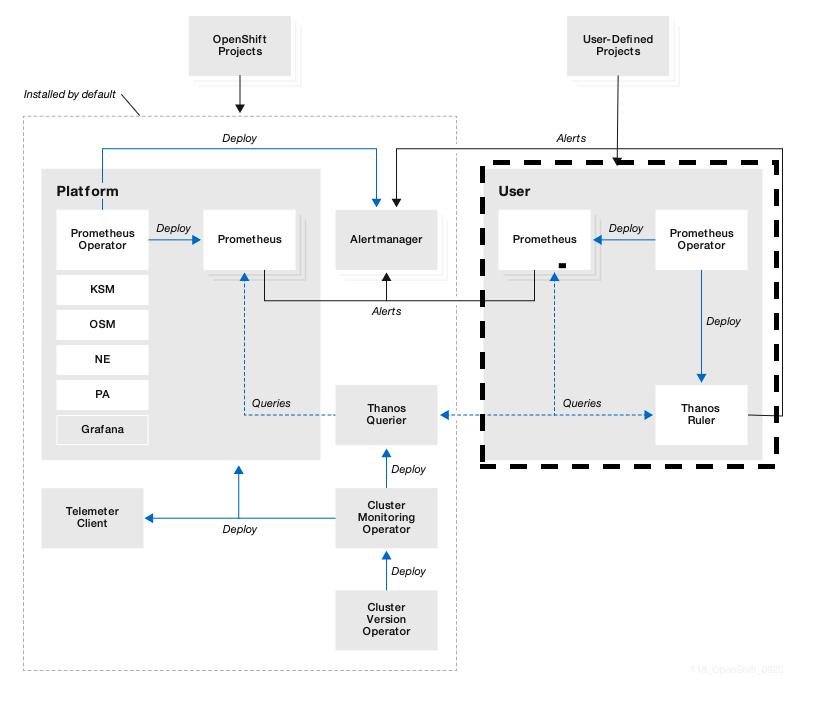
User-Defined Project's metric would be managed by the right part of Monitoring components (i.e., openshift-user-workload-monitoring).
On the left side, all OpenShift Infra-related metrics would be managed by openshift-monitoring namespaces, so they are well separated and have different storage and components for Platform and User-defined.
There are few components that are shared between Platform and User-Defined monitoring components.
Thanos Querier — Aggregates both Platform metrics and User-Defined and provide a unique query interface for searching metrics; In the next part of Grafana configuration, we would use the Thanos Querier URL to display the metrics;
AlertManager — Receiving alert from both sides of Prometheus and sending alert to the external system;
Cluster Monitoring Operator - Provides easy install and maintenance of monitoring components;
The left part is installed out of the box if you installed OpenShift 4.
However, the right part would not be installed by default. We would utilize the User-defined monitoring components to manage the external services metrics. And the steps are the same if you want to manage your own application metrics which run in OpenShift instead of outside.
To enable user-workload-monitoring:
oc apply -f cluster-monitoring-config.yaml
cluster-monitoring-config.yaml
xxxxxxxxxx
```yaml
apiVersion: v1
kind: ConfigMap
metadata:
name: cluster-monitoring-config
namespace: openshift-monitoring
data:
config.yaml: |
enableUserWorkload: true
```
After enabling this, you can see that a new namespace and related monitoring component would be created in these new namespaces:
>oc projects|grep monitoring
openshift-monitoring
openshift-user-workload-monitoring
>oc get po -n openshift-user-workload-monitoring
NAME READY STATUS RESTARTS AGE
prometheus-operator-6bf7fbbbdd-m8fsl 2/2 Running 0 9d
prometheus-user-workload-0 5/5 Running 0 23d
prometheus-user-workload-1 5/5 Running 0 23d
thanos-ruler-user-workload-0 3/3 Running 1 23d
thanos-ruler-user-workload-1 3/3 Running 1 23d
OK, now Openshift User-Defined Monitoring components have been ready.
Let's move on and create a new namespace to host a proxy to external services metrics.
Proxy External Service in OpenShift via Kubernetes Service
For readers who are familiar with the following concepts, you can just check my lab code at https://github.com/ryanzhang/openshift-monitor-external-service.
1. Create a new project to host my proxy and metrics collecting configuration for external metrics and configuration.
>oc new-project external-service
2. Create a Kubernetes service to integrate external service which points to external metric rest endpoints.
xxxxxxxxxx
### a. Create Proxy service pointing external service
```bash
oc apply -f external-service-proxy.yaml
```
```yaml
apiVersion: v1
kind: Service
metadata:
labels:
external-service-monitor: "true"
name: external-service-monitor <- *It would match the followed endpoints names*
namespace: external-service
spec:
ports:
- name: web
port: 8080
protocol: TCP
targetPort: 8080
nodeport: 0
selector: {} <-*It needs to none*
sessionAffinity: None
type: ClusterIP
---
kind: "Endpoints"
apiVersion: "v1"
metadata:
name: "external-service-monitor"
subsets: <-**Use this to specify an external service through IP**
- addresses:
- ip: "192.168.2.10"
ports:
- port: 8080 <- *Point to our todo-app service port*
name: "web"
```
### b. Tell OpenShift User Workload monitor where to look for collecting metrics
```
oc apply -f todo-app-metric-service-monitor.yaml
```
```yaml
apiVersion: monitoring.coreos.com/v1
kind: ServiceMonitor
metadata:
name: app-prometheus-external-service
namespace: external-service
spec:
endpoints:
- interval: 30s <- Set interval to every 30 seconds to collect the metrics from external service endpoints
port: web
scheme: http
selector:
matchLabels:
external-app-monitor: "true" <-Select svc by match this label, we already mark this label in above service
```
## c. Check the service pointingto external endpoints
```
oc describe svc ext-app-metric-todo-app
Name: ext-app-metric-todo-app
Namespace: external-service
Labels: app.kubernetes.io/managed-by=Helm
external-app-monitor=true <-User-Defined Monitoring would use this label to collect this service metrics
Selector: <none>
Type: ClusterIP
IP: 10.217.5.220
Port: web 8080/TCP
TargetPort: 8080/TCP
Endpoints: 192.168.2.10:8080 <- Correct!
Session Affinity: None
Events: <none>
```
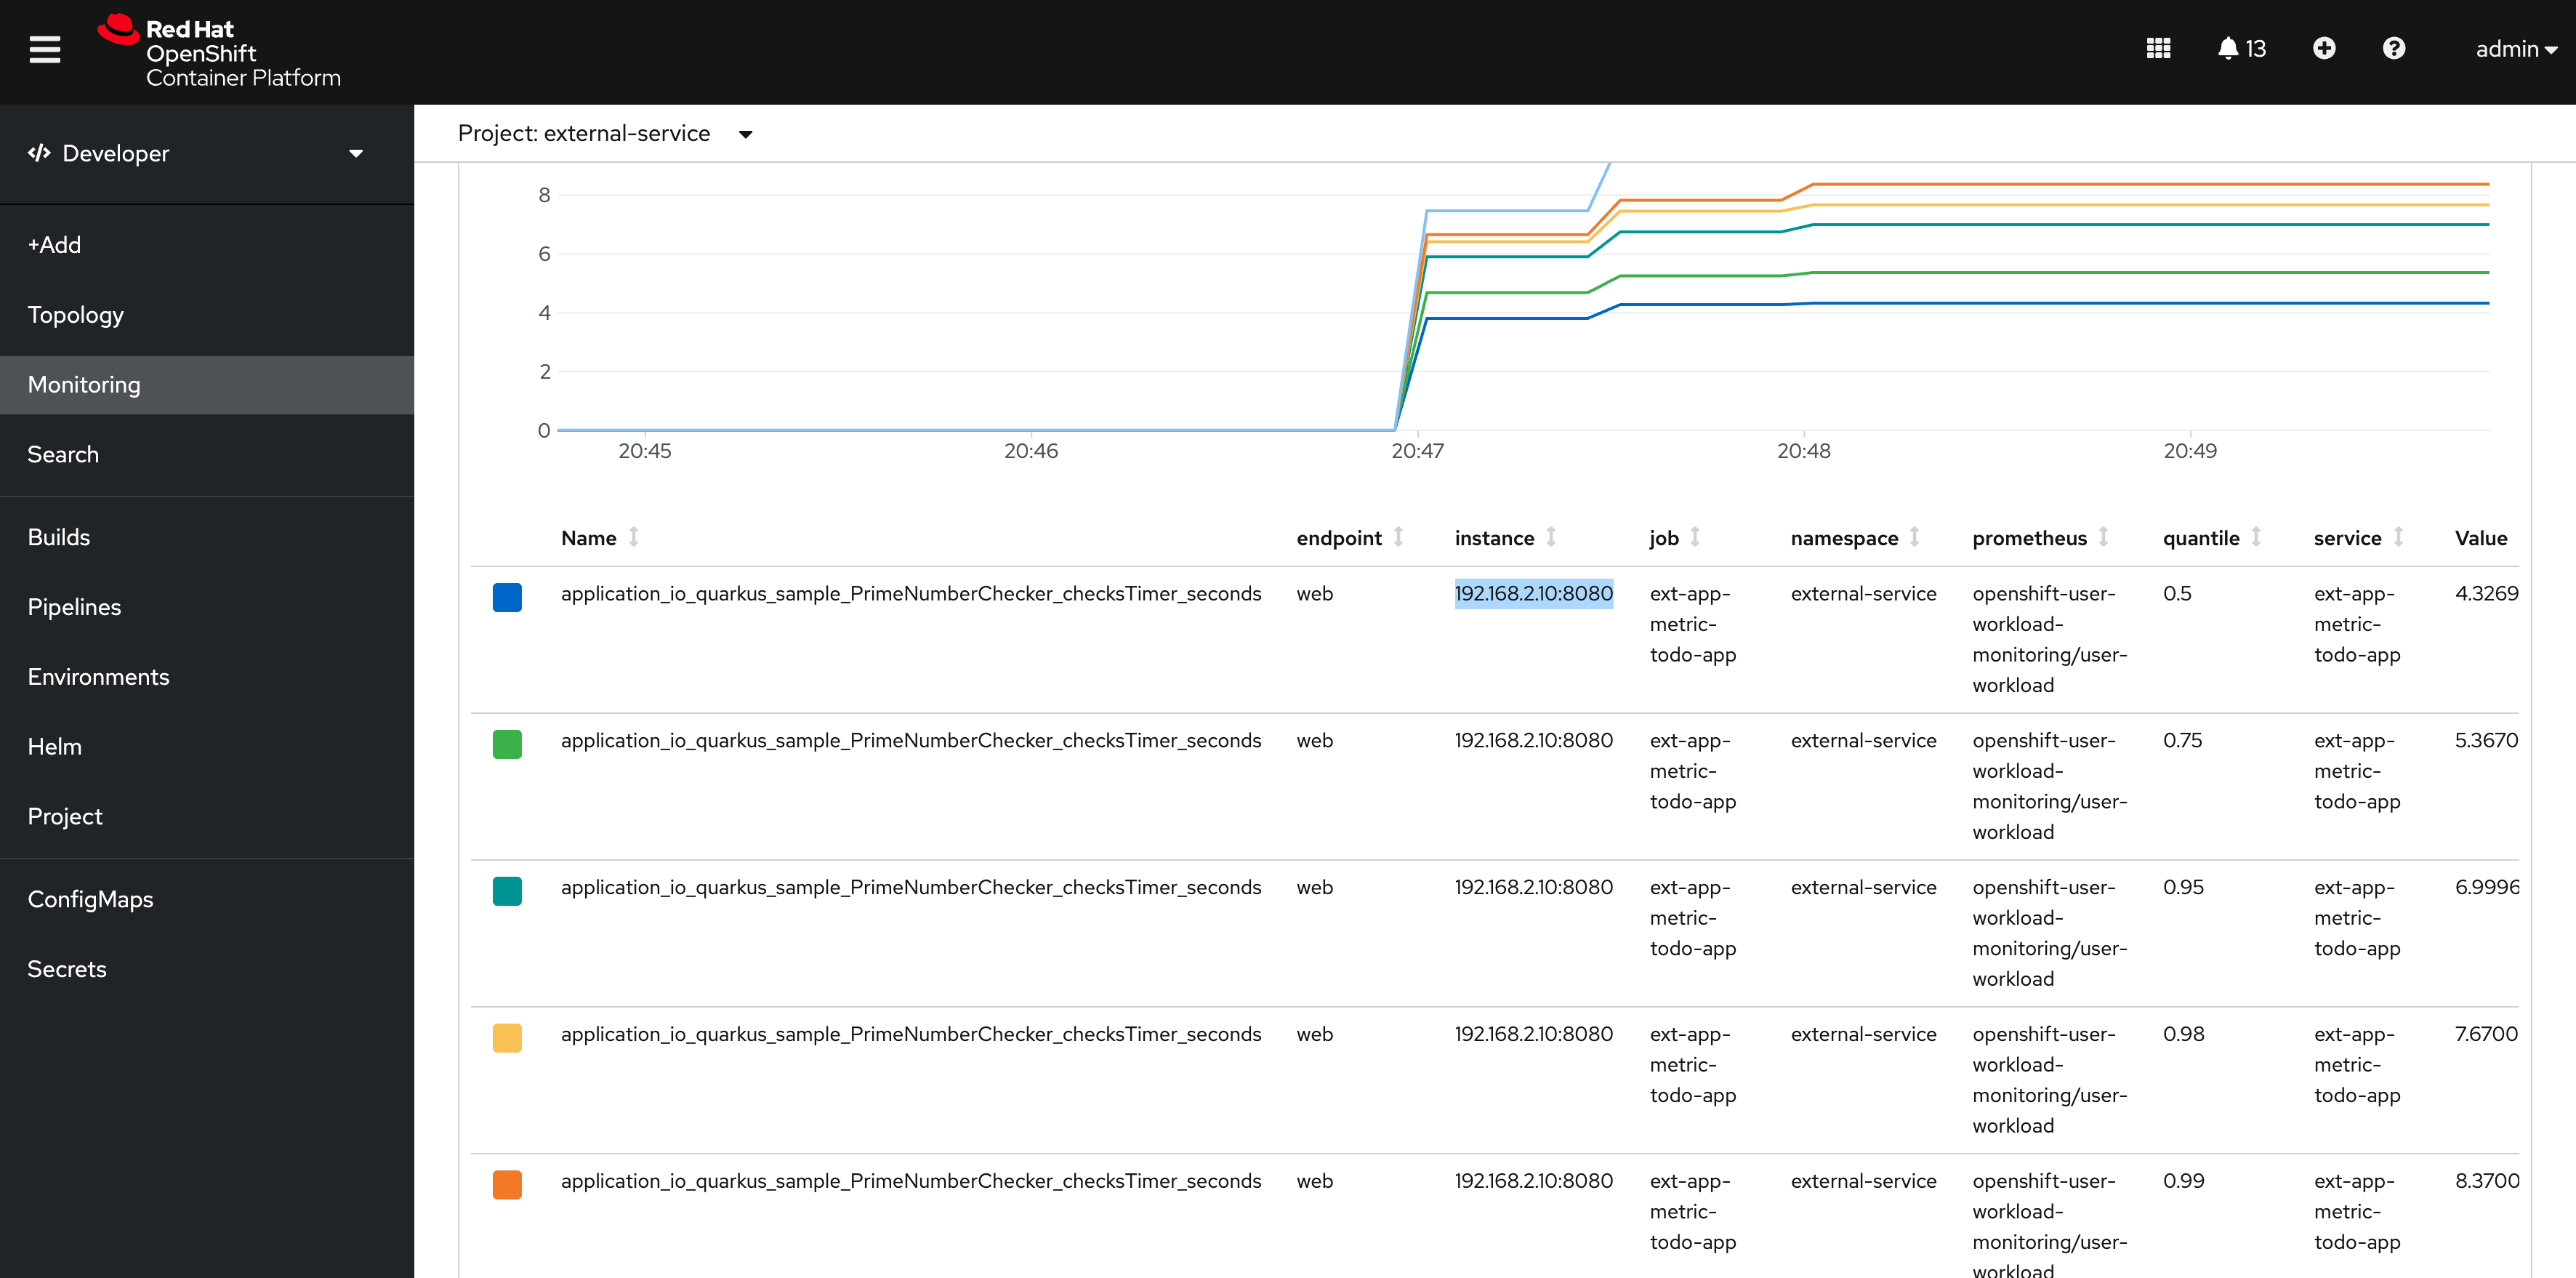
Now you can monitor the external metric in the embedded dashboard:
First trigger some load via ab test tools:
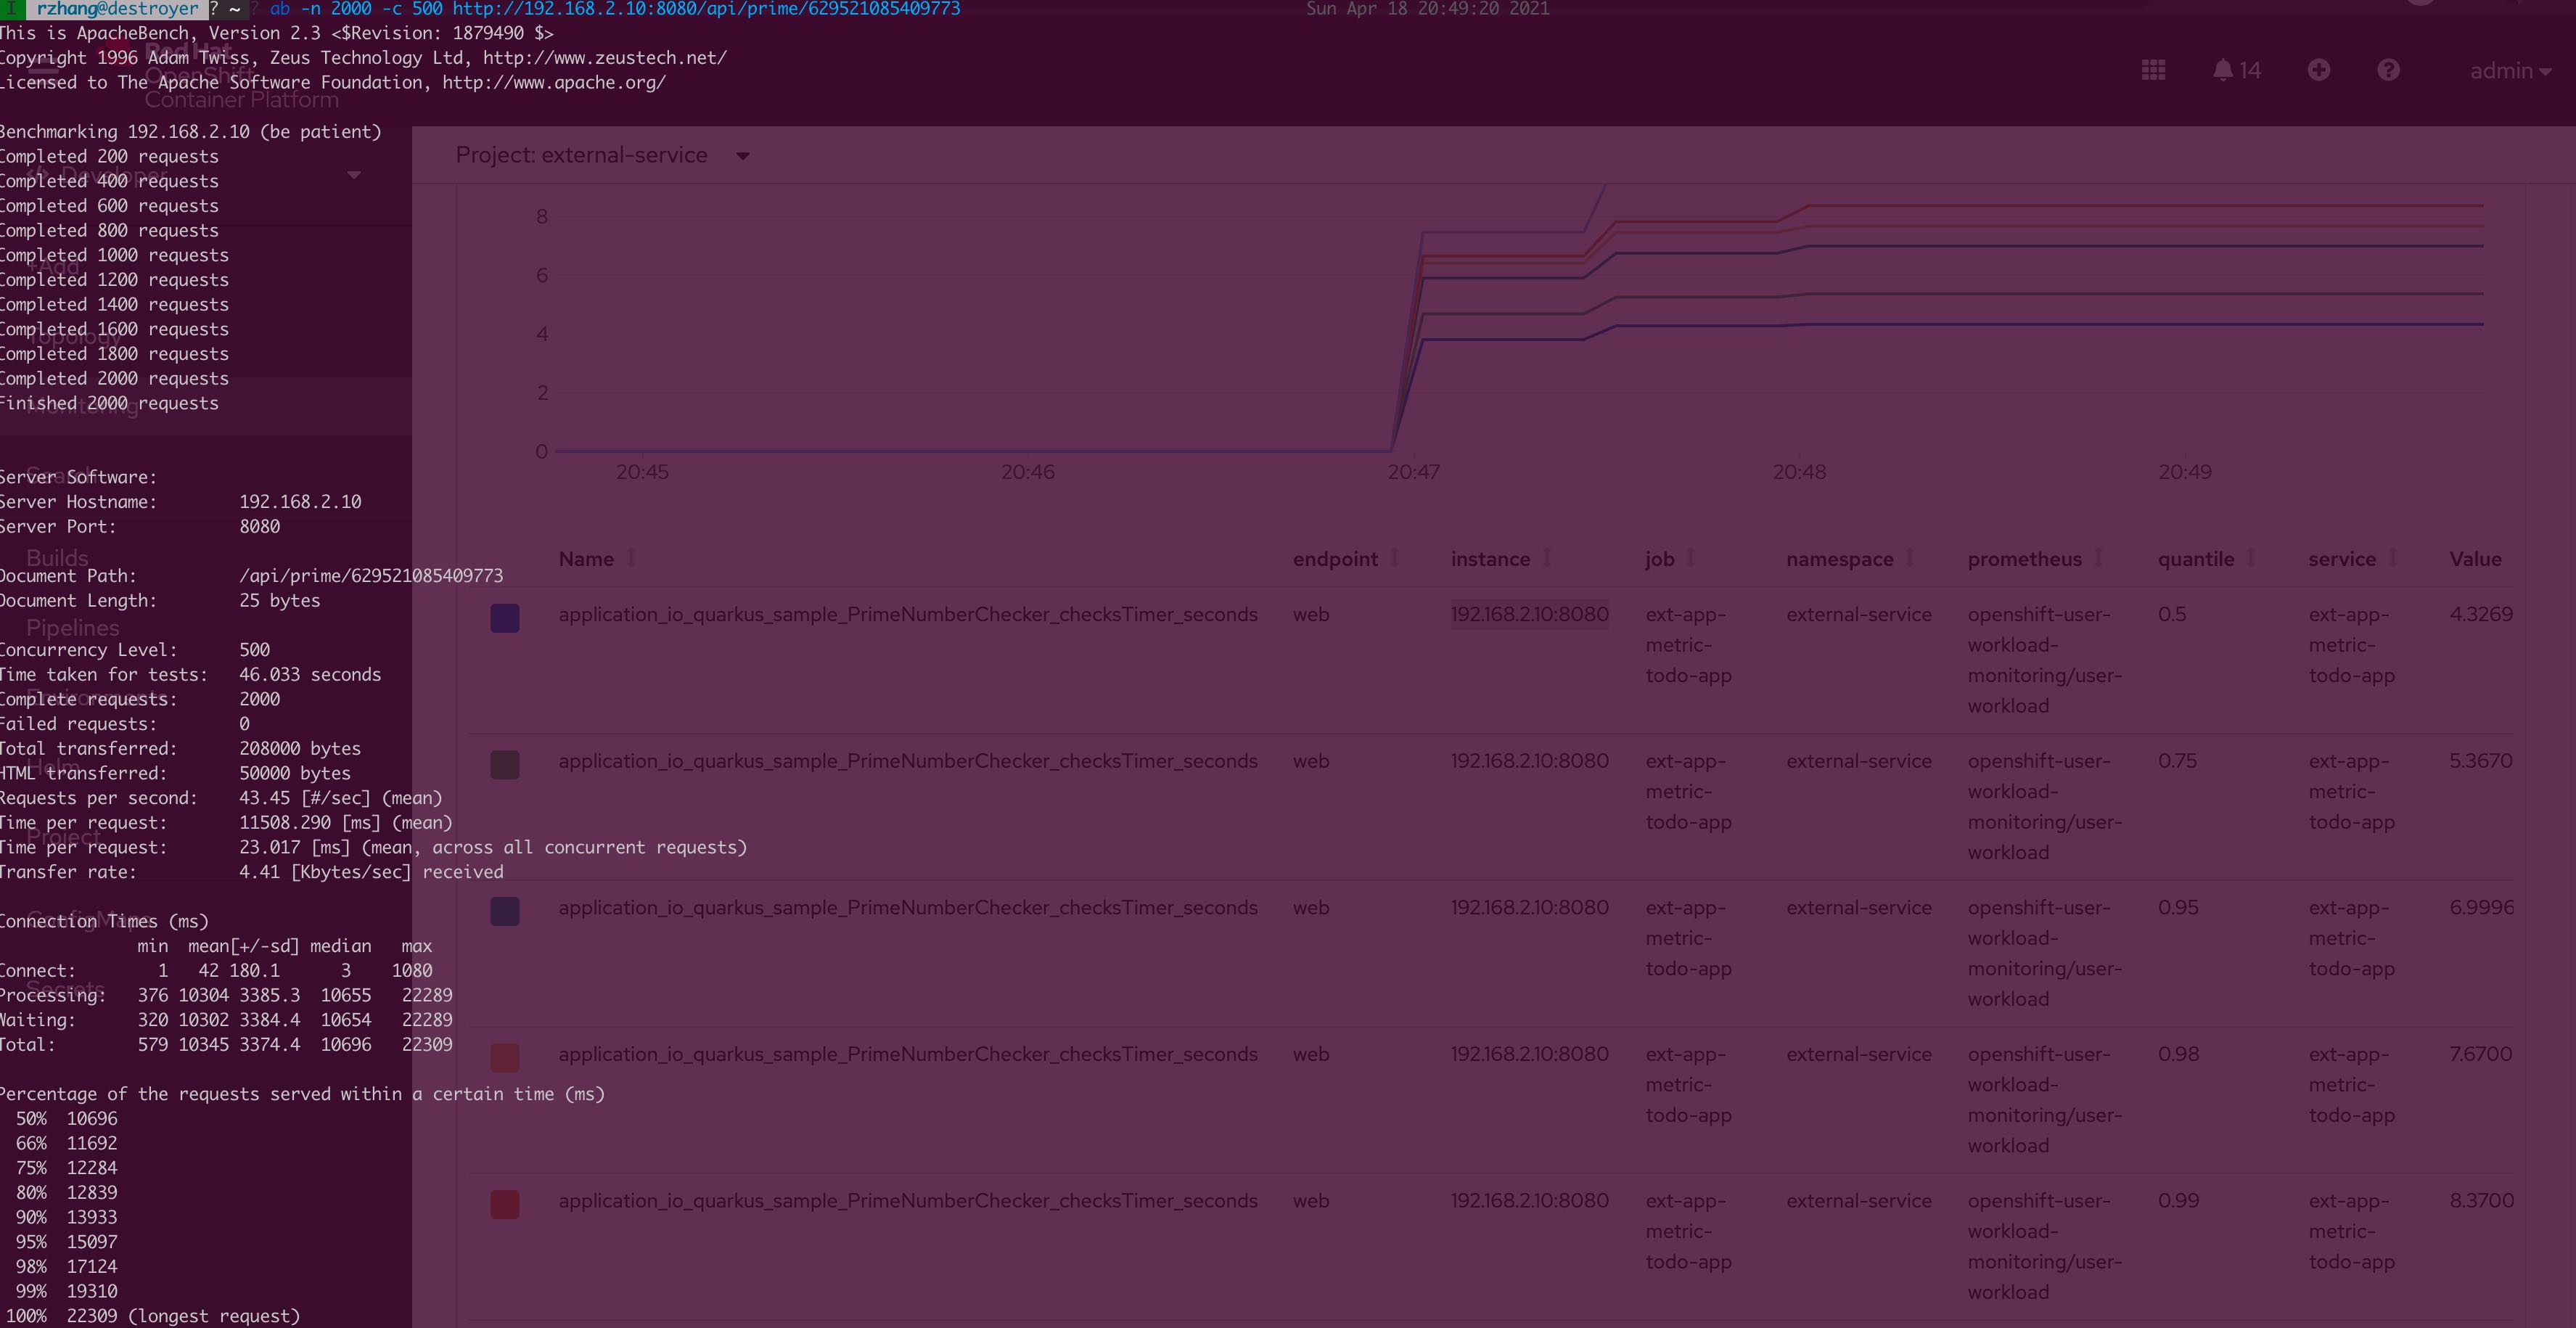
Search metrics in OpenShift integrated UI:
Create Grafana Instance to Display External Service Metrics
Wouldn't it be great if we can view our user-defined metric in Grafana?
Although OpenShift has installed Grafana out of the box, they are not supposed to be used by user-defined workloads. Currently, there is no way to edit and add a user-defined dashboard or create more user accounts for the default Grafana instance.
So let me show you how to install a user-defined Grafana to integrate our own metrics.
Install the Grafana Operator Into my-grafana Namespaces
1. oc new-project my-grafana
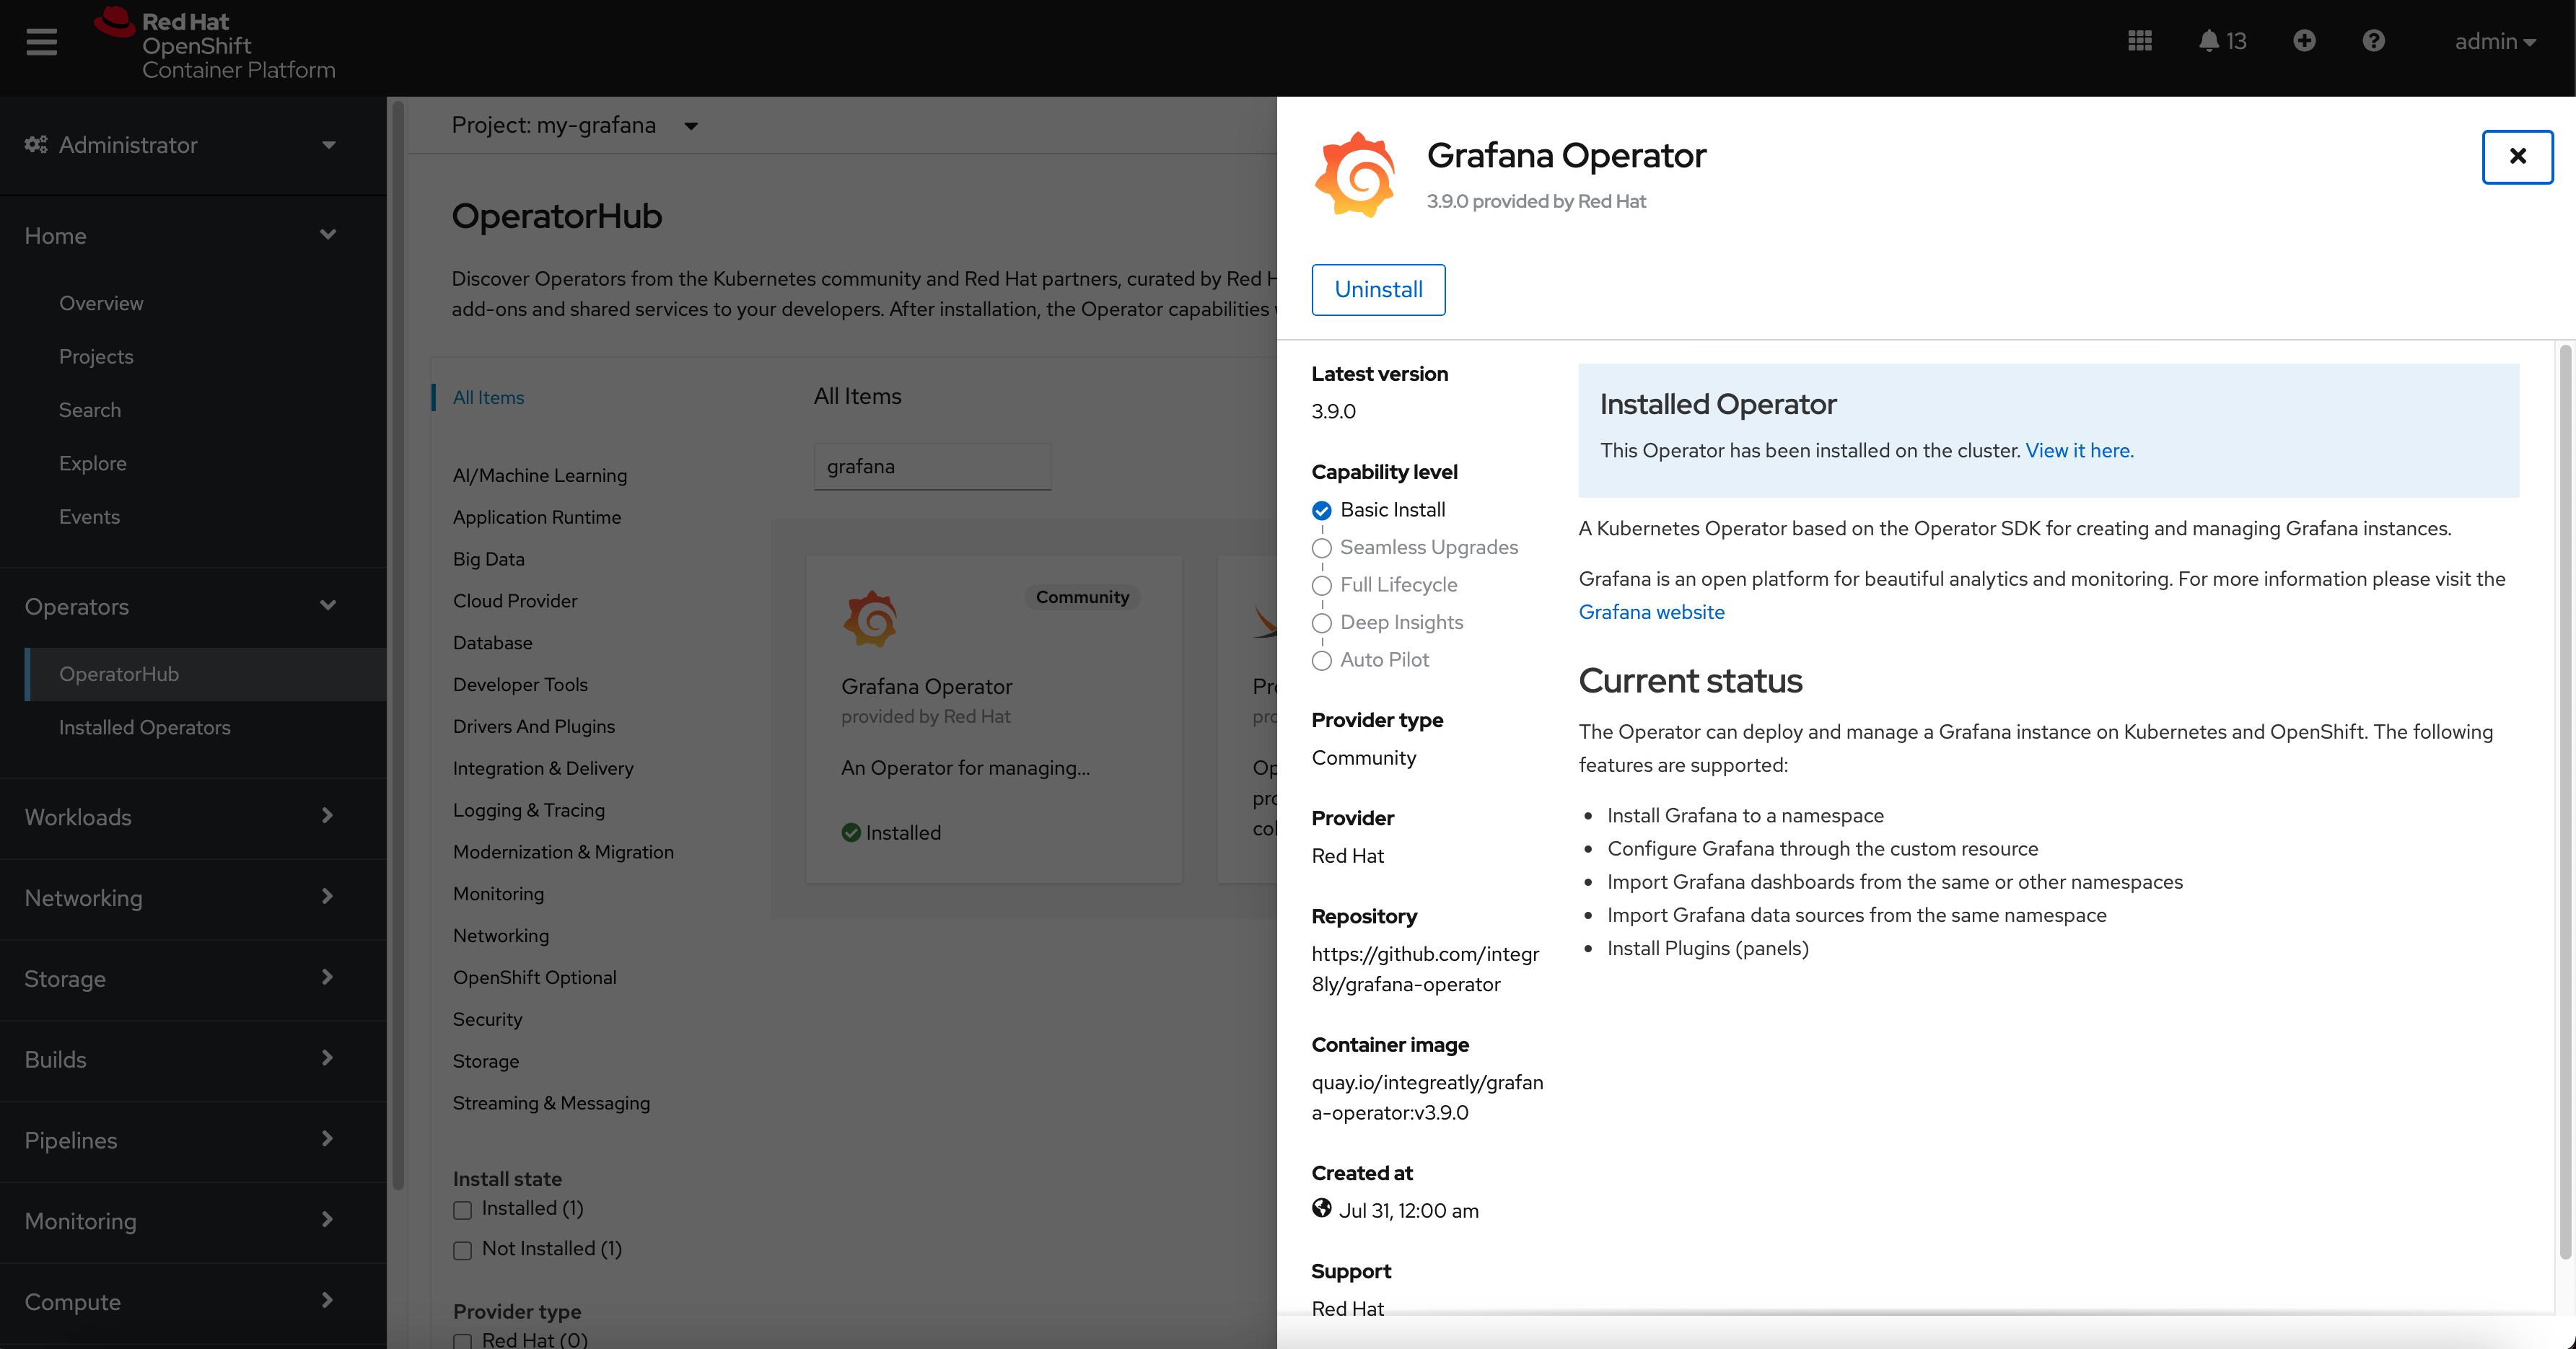
2. Create a my-grafana instance to host my metrics dashboards:
xxxxxxxxxx
## create my-grafana Customer Resources
```yaml
apiVersion: integreatly.org/v1alpha1
kind: Grafana
metadata:
name: my-grafana
namespace: my-grafana
spec:
config:
auth:
disable_signout_menu: false
auth.anonymous:
enabled: true
log:
level: warn
mode: console
security:
admin_password: admin <-1. this is your frist time login password
admin_user: admin
dashboardLabelSelector:
- matchExpressions:
- key: app
operator: In
values:
- grafana
dataStorage:
labels: # Additional labels for the PVC
app: grafana
annotations: # Additional annotations for the PVC
app: grafana
accessModes: # An array of access modes, e.g. `ReadWriteOnce`
- ReadWriteMany
size: '10Gi' # Requested size, e.g. `10Gi`
class: "" <-2. you can input StorageClass Name if there is available
ingress:
enabled: true
hostname: my-grafana.apps-crc.testing <- 3. You need to input your own subdomain here.
```
```
oc apply -f my-grafana-cr.yaml
oc get po
NAME READY STATUS RESTARTS AGE
grafana-deployment-789d66454d-xkdwk 1/1 Running 0 23d
grafana-operator-5bddbfb9f9-x72jv 1/1 Running 0 24d
oc get route
NAME HOST/PORT PATH SERVICES PORT TERMINATION WILDCARD
grafana-route my-grafana.apps-crc.testing grafana-service 3000 edge None
```
## Configure the cluster-monitor-view-rolebinding
```yaml
apiVersion: rbac.authorization.k8s.io/v1
kind: ClusterRoleBinding
metadata:
name: cluster-monitoring-view
roleRef:
apiGroup: rbac.authorization.k8s.io
kind: ClusterRole
name: cluster-monitoring-view
subjects:
- kind: ServiceAccount
name: grafana-serviceaccount <- Bind the grafana-serviceaccount to cluster role: cluster-monitoring-view
namespace: my-grafana
```
```bash
oc apply -f cluster-monitoring-view-clusterrolebinding.yaml
```
Now you can access my-grafana instance via: https://my-grafana.apps-crc.testing/
Login in with admin/admin.
Add my todo-app quarkus MicroProfile Metrics dashboard.
To find more information on how to generate MicroProfile Metrics for your application, I recommend you to check this: https://github.com/jamesfalkner/microprofile-grafana
Here we go:
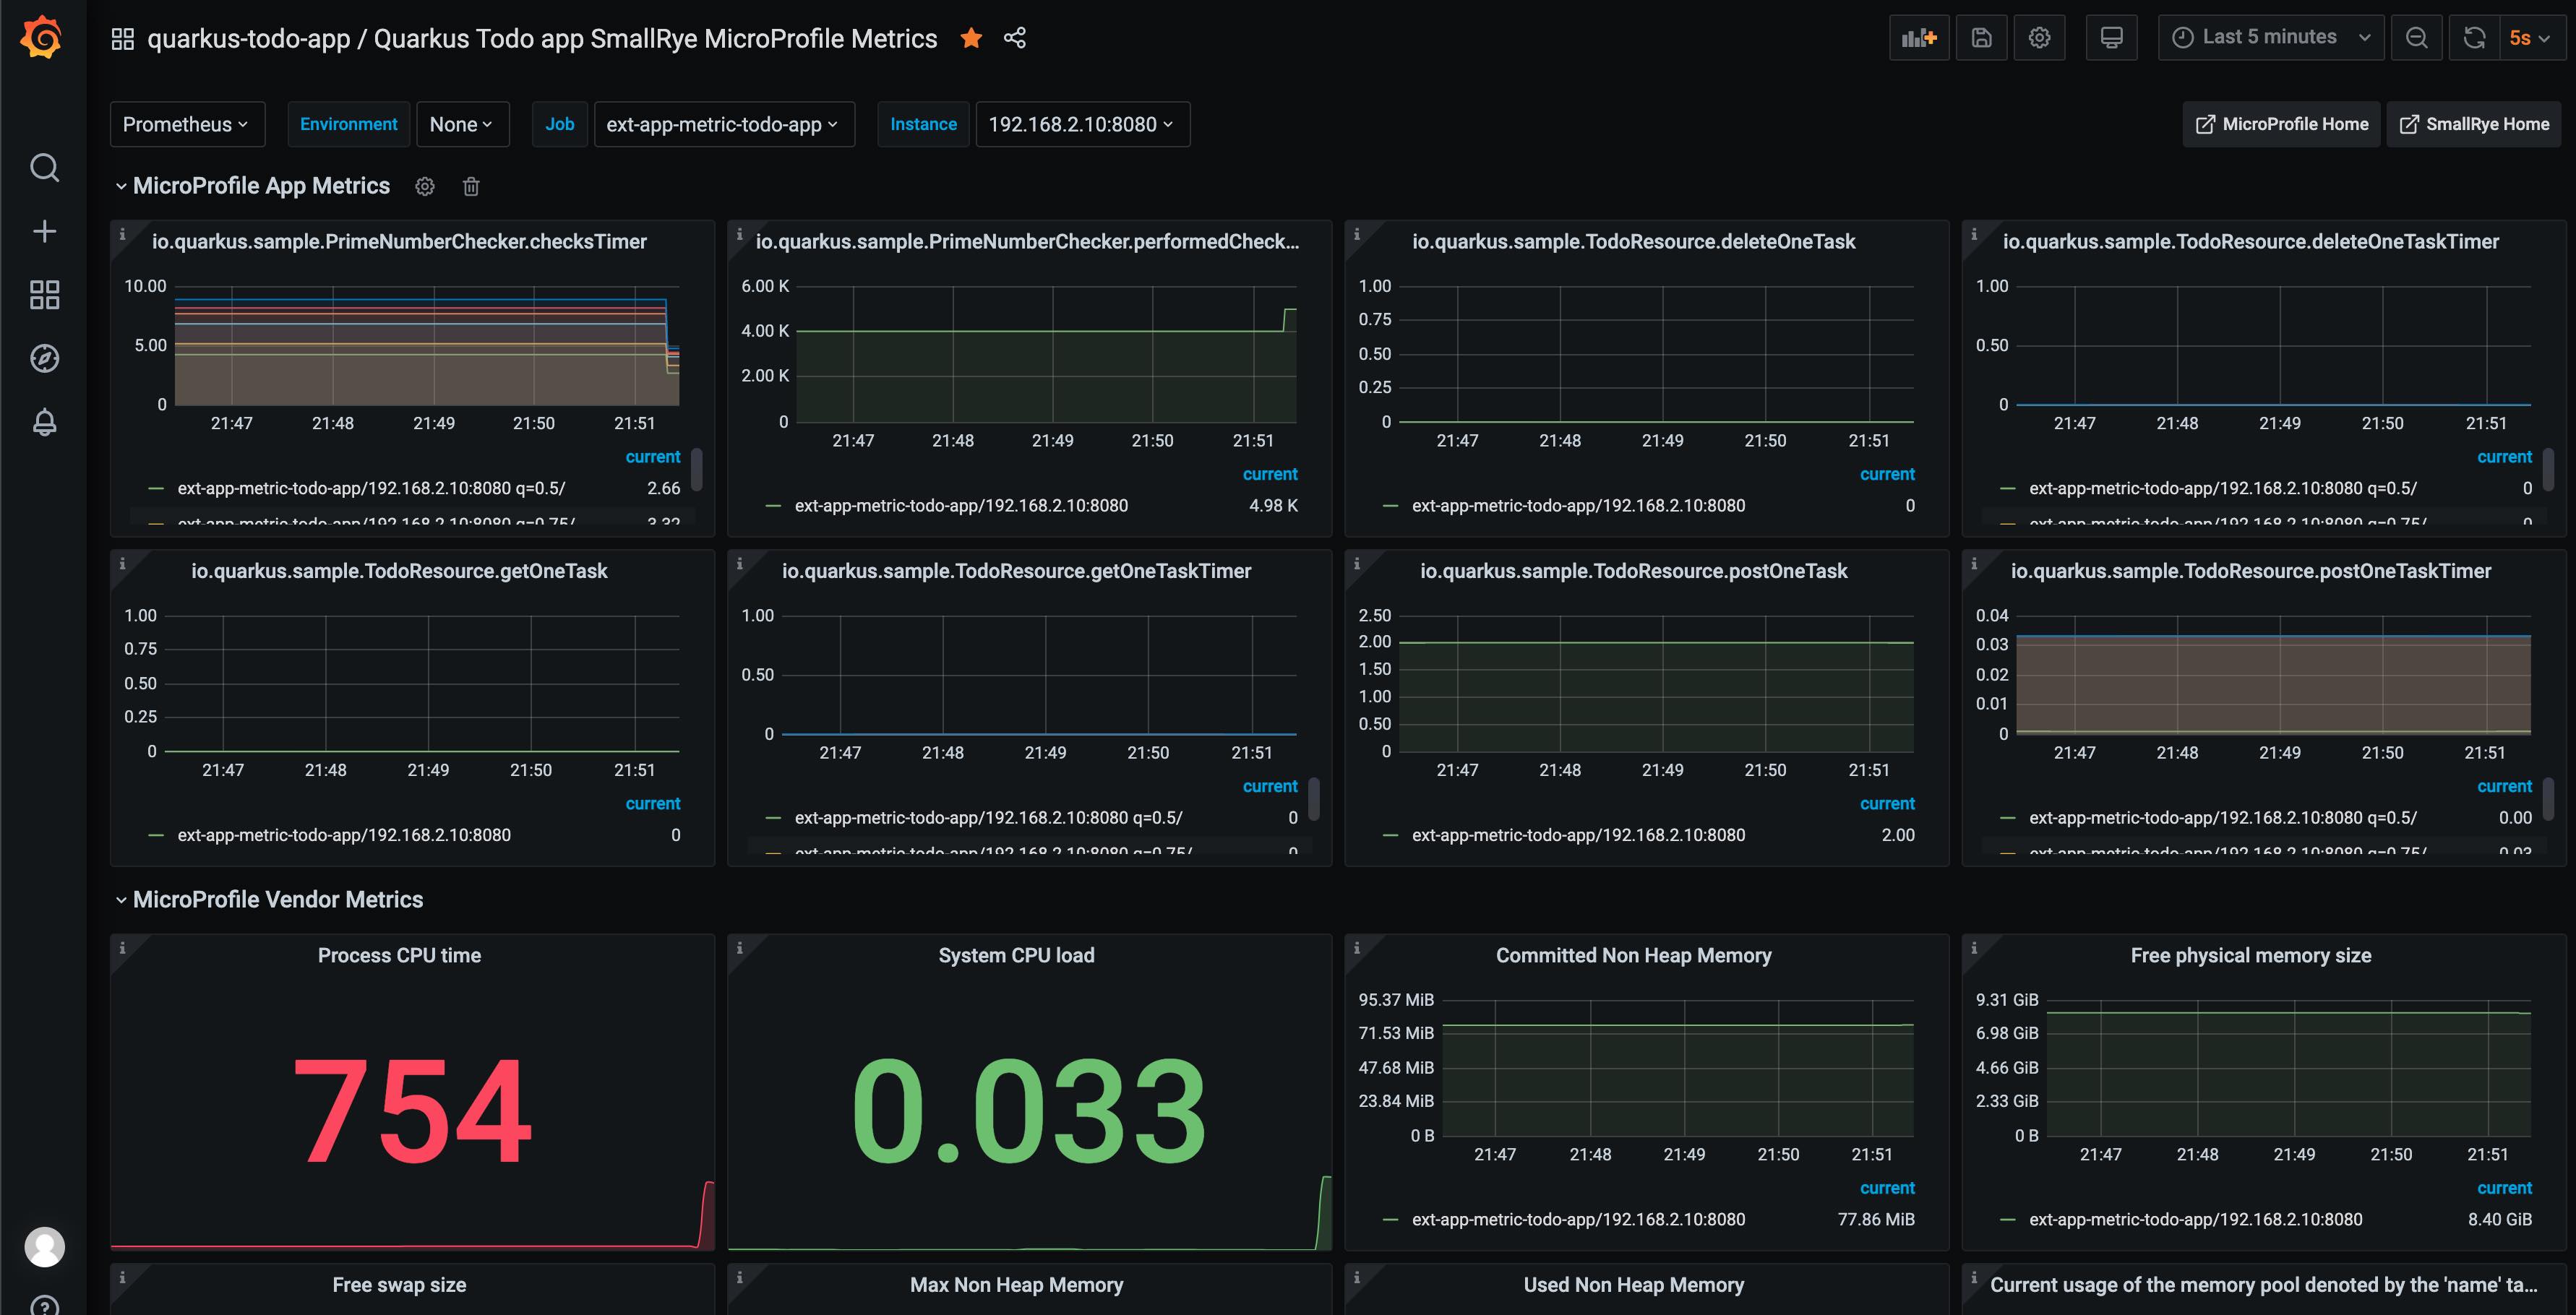
(I also trigger a load test at the backend for monitoring the metrics.)
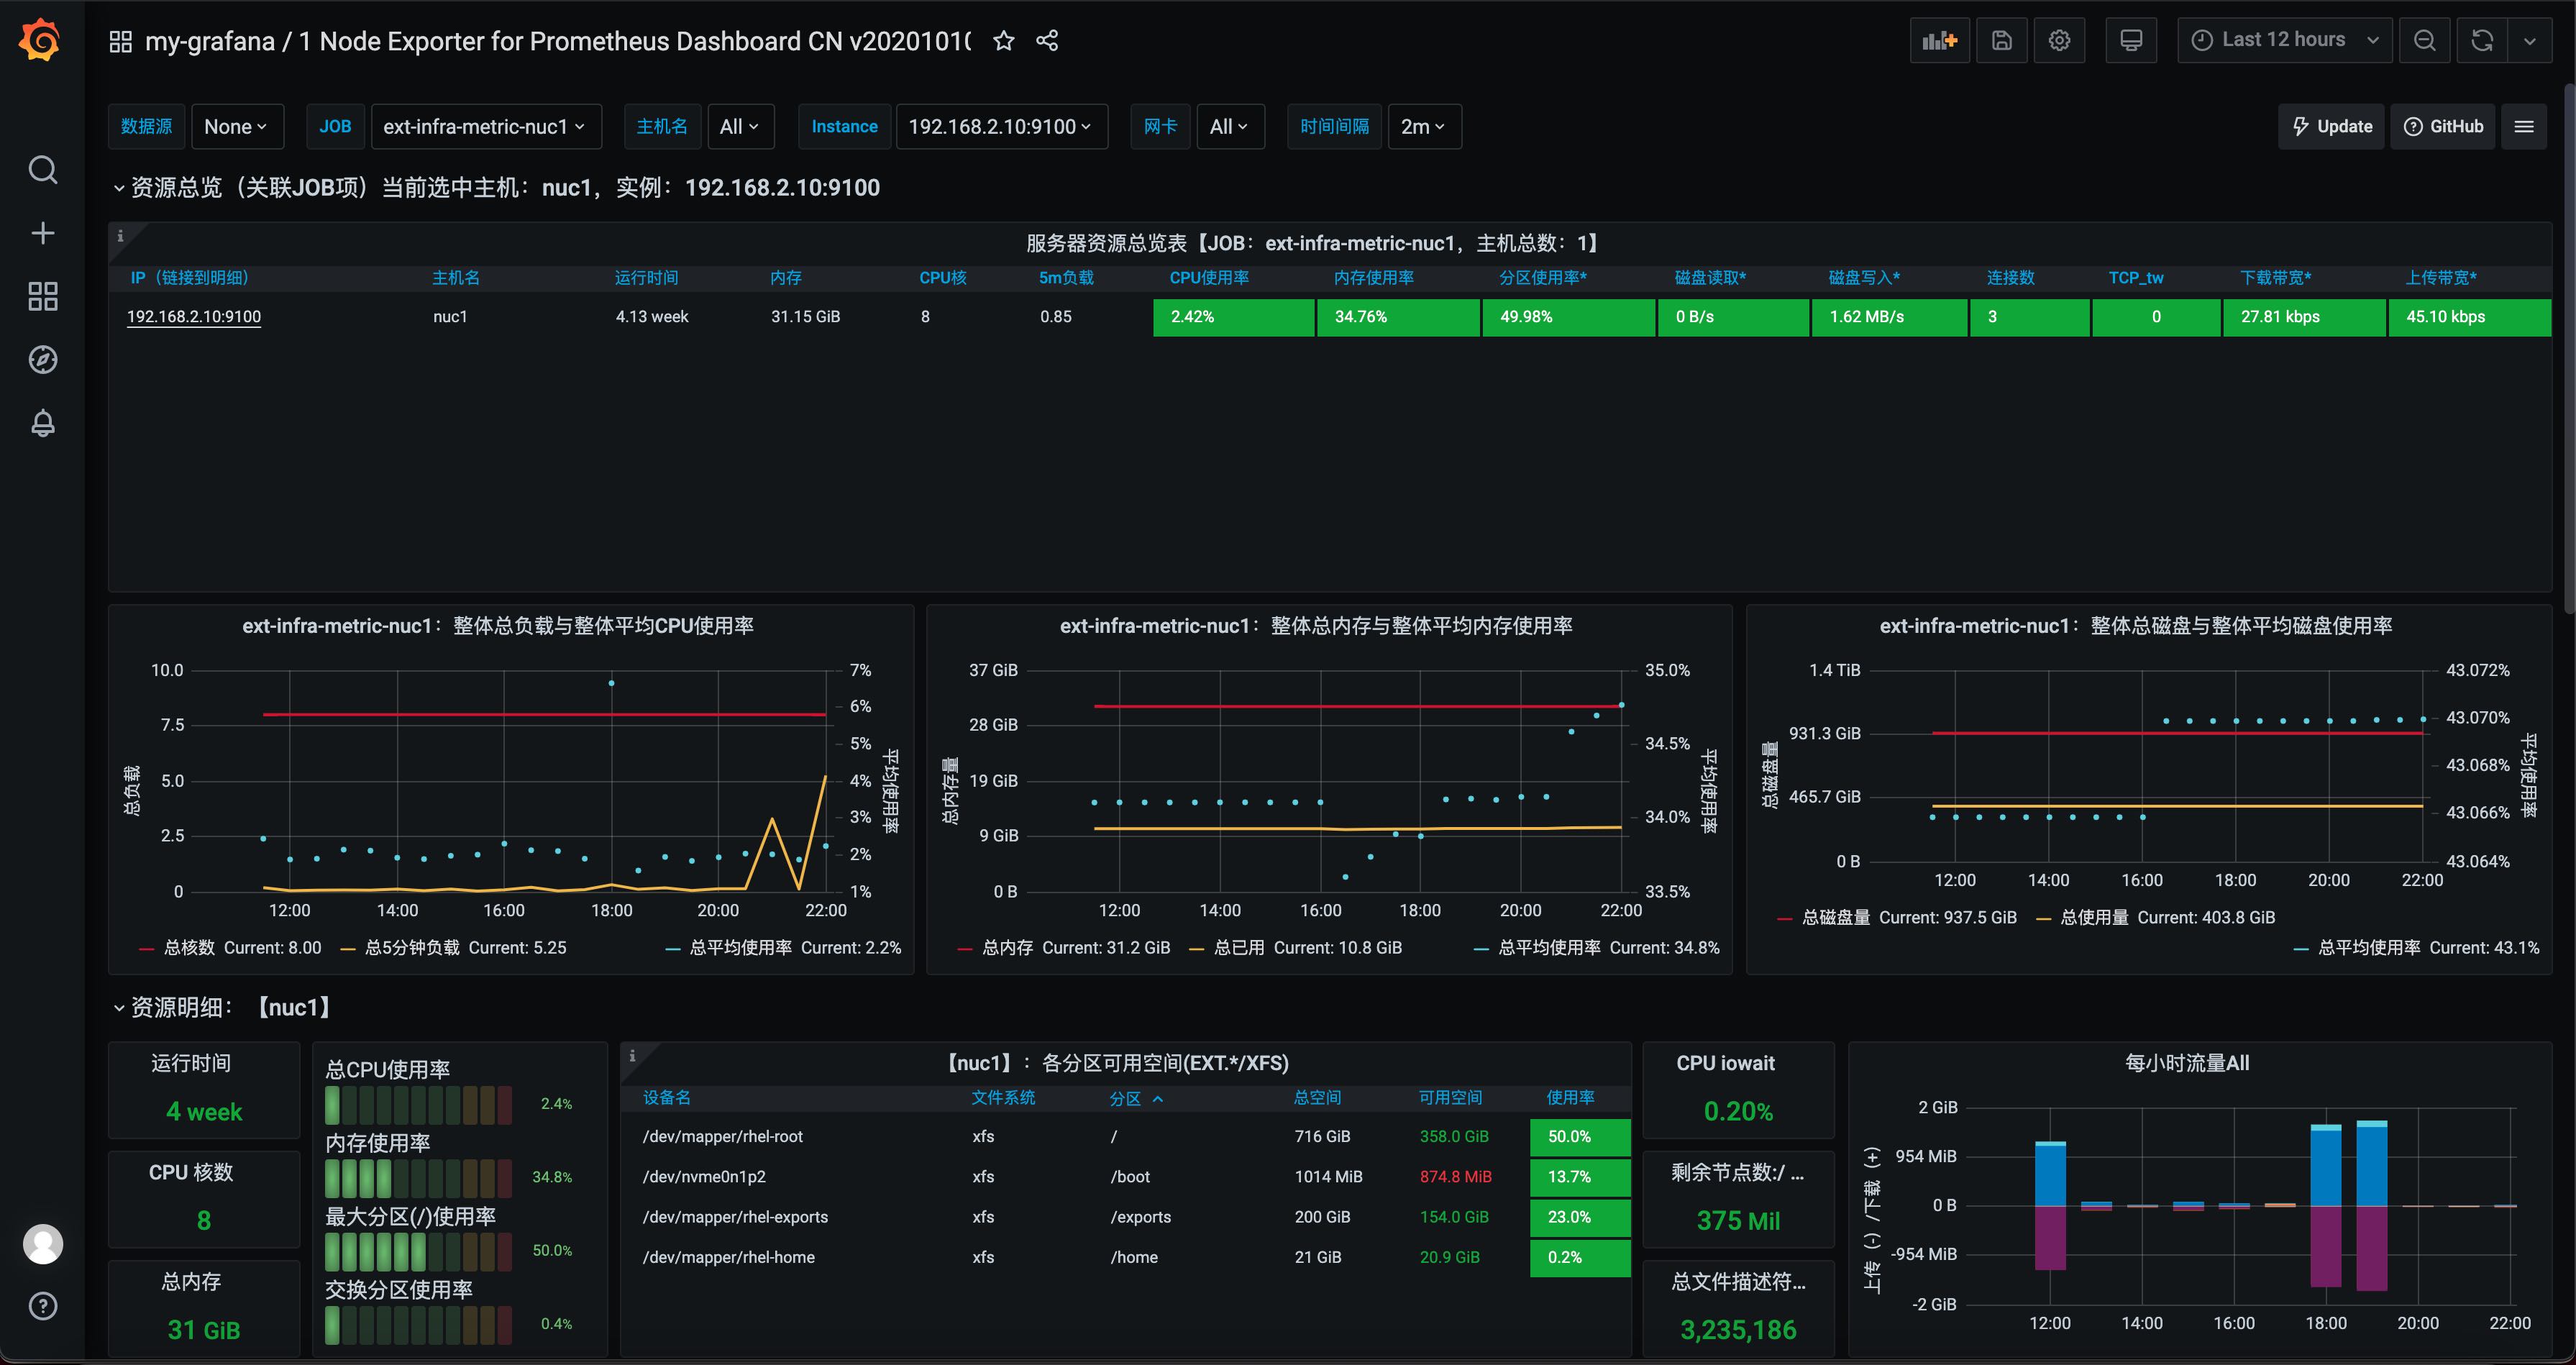
What's more, you could monitor external infra metrics by utilizing the node_exporter process.
(Optional) Utilize Node Exporter to Monitor External Infra Metrics
Please follow Prometheus official documentation to install node_exporter to your VM or bare metal, then you would have the metrics available at, for example in my case:
Repeat the above steps, or take a look at the YAML resource in my GitHub repo:
You would get the external infra metrics managed in user-defined monitoring components.
Here is the node_exporter dashboard I used in the following graph.
OpenShift monitoring components are easy to install and operate. I hope it's useful to show you that we can not only integrate the container-based workload's metrics inside OpenShift but also external services and infra metrics outside OpenShift.
Opinions expressed by DZone contributors are their own.
Comments