VPC Flow Log Analysis With the ELK Stack
There are many ways to integrate CloudWatch with the ELK Stack. See how to use a Lambda function to send logs directly from CloudWatch into the Logz.io ELK Stack.
Join the DZone community and get the full member experience.
Join For FreeIf you’re using AWS, CloudWatch is a powerful tool to have on your side. If used correctly, it will allow you to monitor how the different services on which your application relies are performing. Setting it up is painless, with some of the services outputting logs to CloudWatch automatically.
The challenge, of course, is getting the logs out of CloudWatch. While the logs stored on CloudWatch can be searched either using the console or CLI, there is no easy way to properly visualize and analyze the data. That’s why integrating CloudWatch with a third-party platform such as the ELK Stack makes sense.
There are a few ways of building this integration. AWS added the option to batch export from CloudWatch to either S3 or AWS Elasticsearch. Batch is nice but not a viable option in the long run.
Another option is to use Kinesis Firehose and a CloudWatch subscription filter to ship to S3 and from there into ELK using the Logstash S3 input plugin — or, if you are using Logz.io, with our built-in support for S3. It’s not exactly the most intuitive workflow, to say the least.
In this post, I’d like to explore another option: using a Lambda function to send logs directly from CloudWatch into the Logz.io ELK Stack.
VPC Flow Logs
The logs used for exploring this workflow were VPC Flow logs.
VPC Flow logs provide the ability to log all of the traffic that happens within an AWS VPC (Virtual Private Cloud). The information captured includes information about allowed and denied traffic (based on security group and network ACL rules). It also includes source and destination IP addresses, ports, IANA protocol numbers, packet and byte counts, time intervals during which flows were observed, and actions (ACCEPT or REJECT).
VPC Flow logs can be turned on for a specific VPC, a VPC subnet, or an Elastic Network Interface (ENI). Most common uses are around the operability of the VPC. You can visualize rejection rates to identify configuration issues or system misuses, correlate flow increases in traffic to load in other parts of systems, and verify that only specific sets of servers are being accessed and belong to the VPC. You can also make sure the right ports are being accessed from the right servers and receive alerts whenever certain ports are being accessed.
Enabling VPC Flow Logs
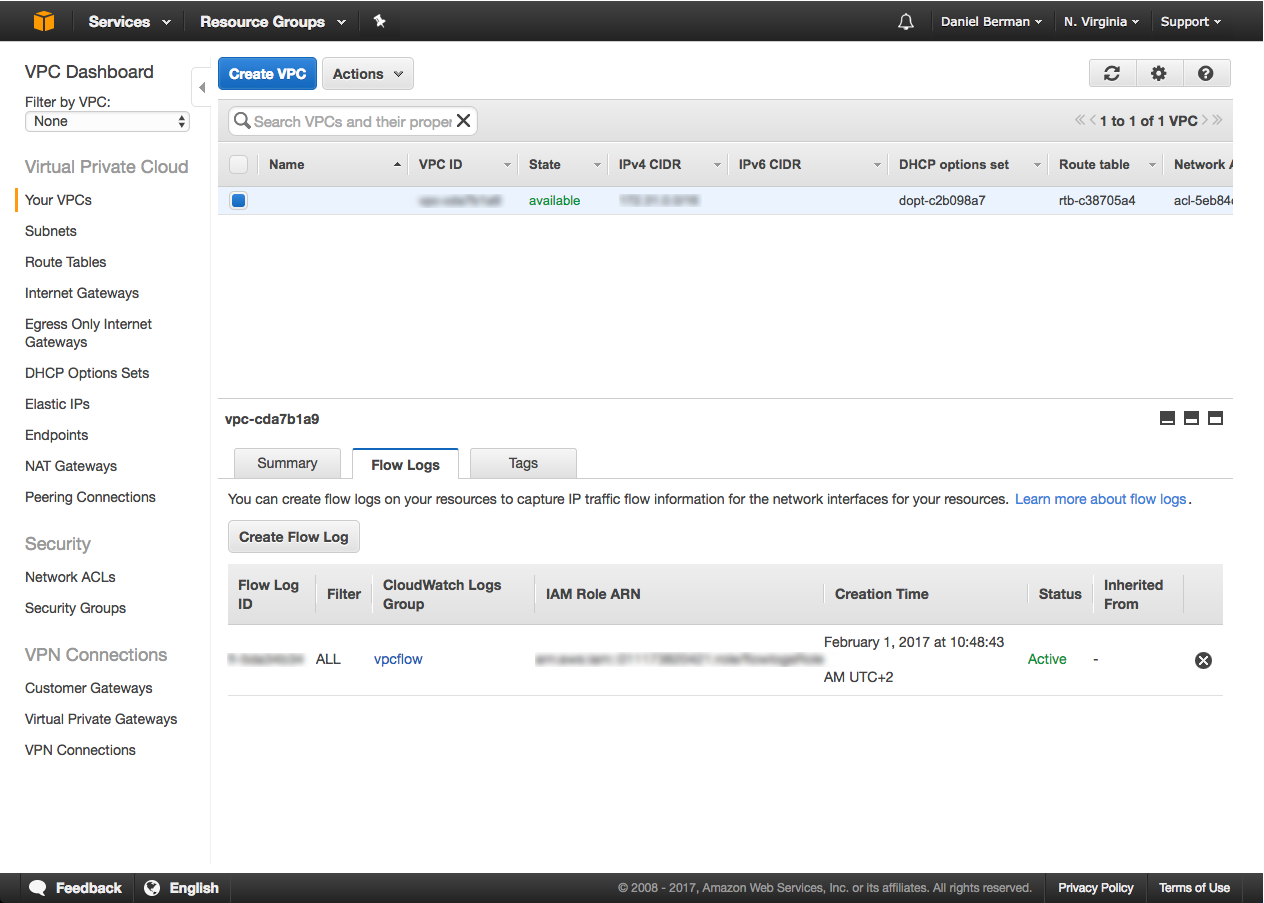
VPC Flow logs are easily enabled via the VPC console. Select the VPC from the list and click Create Flow Log in the Flow Logs tab at the bottom of the page.
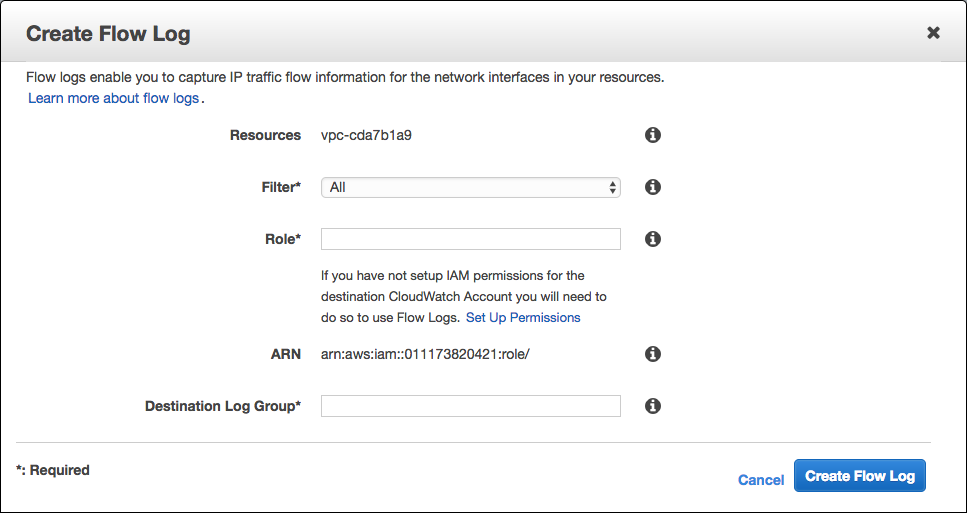
You will then be required to enter an IAM role and a CloudWatch log group as a destination for the logs:
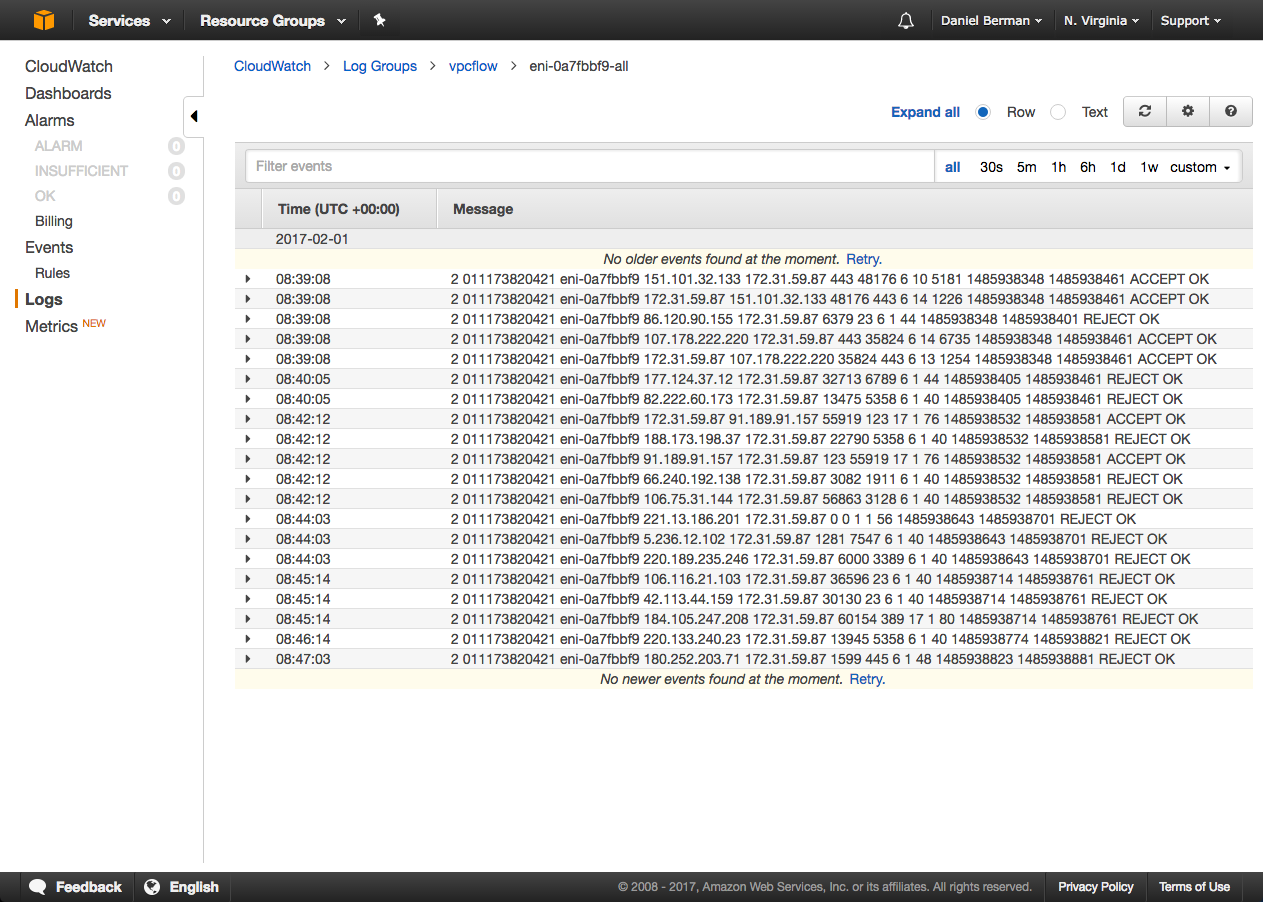
Once done, click Create Flow Log. VPC Flow logs will begin to output to CloudWatch. Hop on over to the CloudWatch console to verify:
Streaming Into ELK
Great. The first part is over. The next step is to create the Lambda function to ship into the Logz.io ELK. We will define an existing CloudWatch log group as the event that will trigger the function’s execution.
Head on to the Lambda console and create a new blank function:
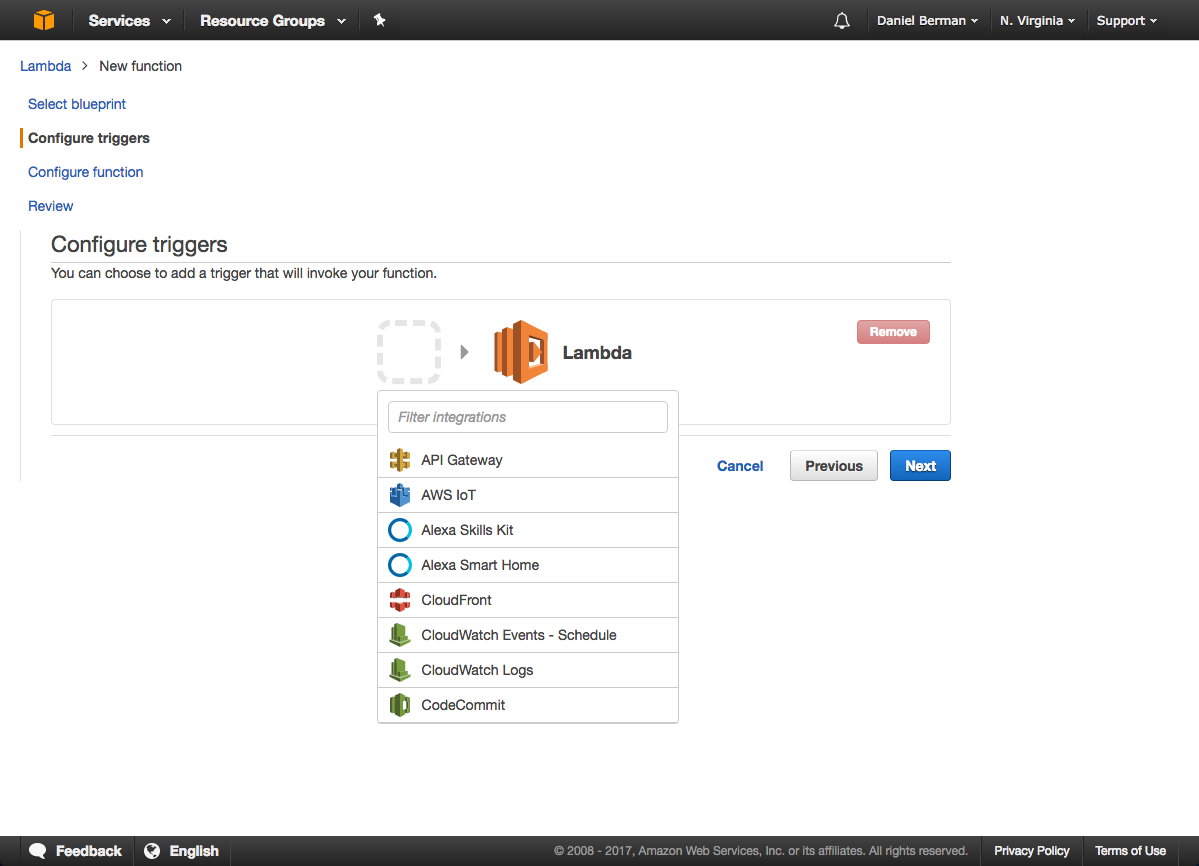
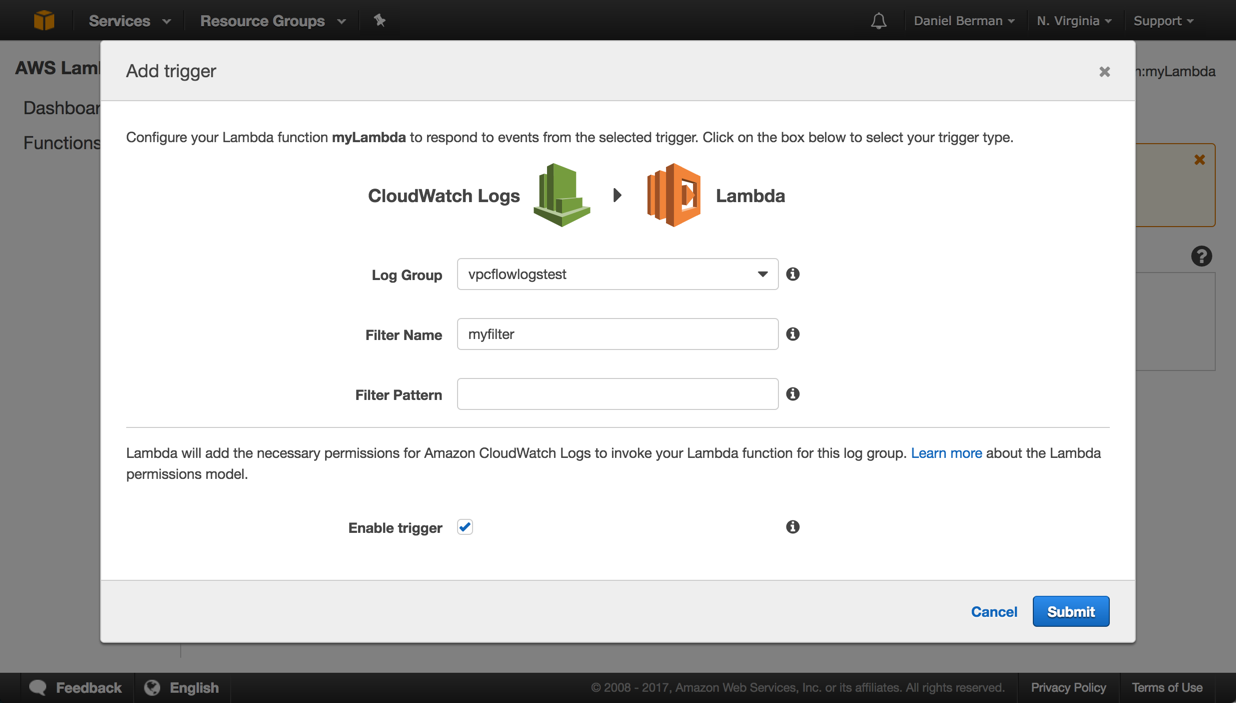
When asked to configure the trigger, select CloudWatch Logs and the relevant log group.
Enter a name for the filter used (i.e. myfilter) and be sure to select the Enable trigger checkbox before continuing:
When configuring your function in the next step, enter a name for the function and select Node.js 4.3 as the runtime environment.
Copy and paste the following code into the code snippet field:
'use strict';

const AWS = require('aws-sdk');
const http = require('https');
const zlib = require('zlib');
const logzioConfiguration = {
   hostName: process.env.logzioHostName,
   hostPort: process.env.logzioHostPort,
   logType: process.env.logzioLogType
};

const decryptParams = {
   CiphertextBlob: new Buffer(process.env.kmsEncryptedCustomerToken, 'base64'),
};

const kms = new AWS.KMS({ apiVersion: '2014-11-01' });
process.stderr.write(process.env.kmsEncryptedCustomerToken);
console.log(process.env.kmsEncryptedCustomerToken);
kms.decrypt(decryptParams, (error, data) => {
   if (error) {
      logzioConfiguration.tokenInitError = error;
      console.log(error);
   } else {
      logzioConfiguration.customerToken = data.Plaintext.toString('ascii');
   }
});

exports.handler = (event, context, callback) => {
   const payload = new Buffer(event.awslogs.data, 'base64');
   function parseEvent(logEvent, logGroupName, logStreamName) {
      var theMessage = logEvent.message.substring(0, logEvent.message.length - 1);

var msgArr = theMessage.split(" ");
      return {
         message: theMessage,
         srcaddr: msgArr[3],
         dstaddr: msgArr[4],
         srcport: parseInt(msgArr[5]),
         dstport: parseInt(msgArr[6]),
         protocol: msgArr[7],
         packets: parseInt(msgArr[8]),
         bytes: parseInt(msgArr[9]),
         start: msgArr[10],
         end: msgArr[11],
         action: msgArr[12],
         logstatus: msgArr[13],
         logGroupName,
         logStreamName,
         "@timestamp": new Date(logEvent.timestamp).toISOString(),
      };

}

function postEventsTologzio(parsedEvents) {
   if (!logzioConfiguration.customerToken) {
      if (logzioConfiguration.tokenInitError) {
         console.log('error in decrypt the token. Not retrying.');
         return callback(logzioConfiguration.tokenInitError);
      }
      console.log('Cannot flush logs since authentication token has not been initialized yet. Trying again in 100 ms.');
      setTimeout(() => postEventsTologzio(parsedEvents), 100);
      return;
   }

   const finalEvent = parsedEvents.map(JSON.stringify).join('\n');
   try {
      const options = {
         hostname: logzioConfiguration.hostName,
         port: logzioConfiguration.hostPort,
         path: `/?token=${logzioConfiguration.customerToken}&type=${encodeURIComponent(logzioConfiguration.logType)}`,
         method: 'POST',
         headers: {
            'Content-Type': 'application/json',
            'Content-Length': finalEvent.length,
         },
      };

      const req = http.request(options, (res) => {
         res.on('data', (data) => {
         console.log(data);
         const result = JSON.parse(data.toString());
         if (result.response === 'ok') {
            callback(null, 'all events are sent to logzio');
         } else {
            console.log(result.response);
         }
      });
      res.on('end', () => {
         console.log('No more data in response.');
         callback();
      });
   });

   req.on('error', (err) => {
      console.log('problem with request:', err.toString());
      callback(err);
   });

      req.write(finalEvent);
      req.end();
   } catch (ex) {
      console.log(ex.message);
      callback(ex.message);
   }
}

zlib.gunzip(payload, (error, result) => {
   if (error) {
      callback(error);
   } else {
      const resultParsed = JSON.parse(result.toString('ascii'));
      const parsedEvents = resultParsed.logEvents.map((logEvent) =>
         parseEvent(logEvent, resultParsed.logGroup, resultParsed.logStream));
      postEventsTologzio(parsedEvents);
   }
 });
};
Next, we need to define the environment variables used by the function. These will define the Logz.io token and endpoint URL.
Since this information is sensitive, we are going to enable encryption helpers and use a pre-configured KMS key.
Enter the following variables:
kmsEncryptedCustomerToken:<logzioToken>logzioHostPort:8071logzioLogType:VPC_FLOWlogzioHostName:listener.logz.io
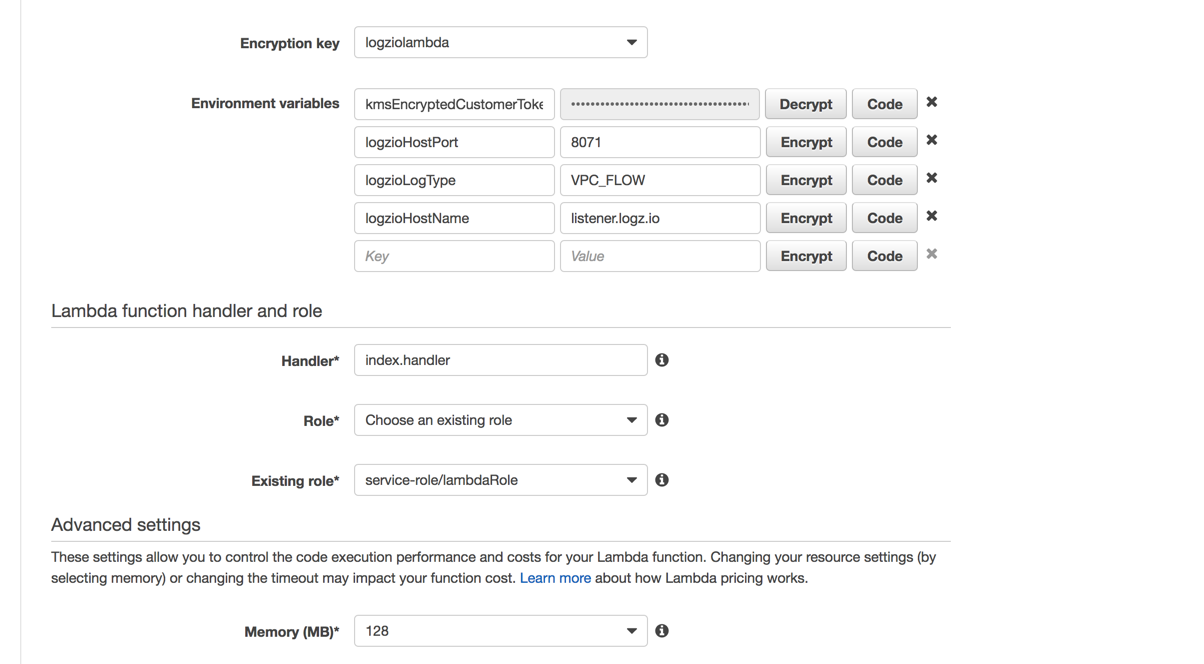
Click Encypt for the first variable to hide the Logz.io user token.
Next, select which IAM role you want to use. You can create a new one if you like, but if you are using an existing role, be sure that it has permissions to access CloudWatch logs.
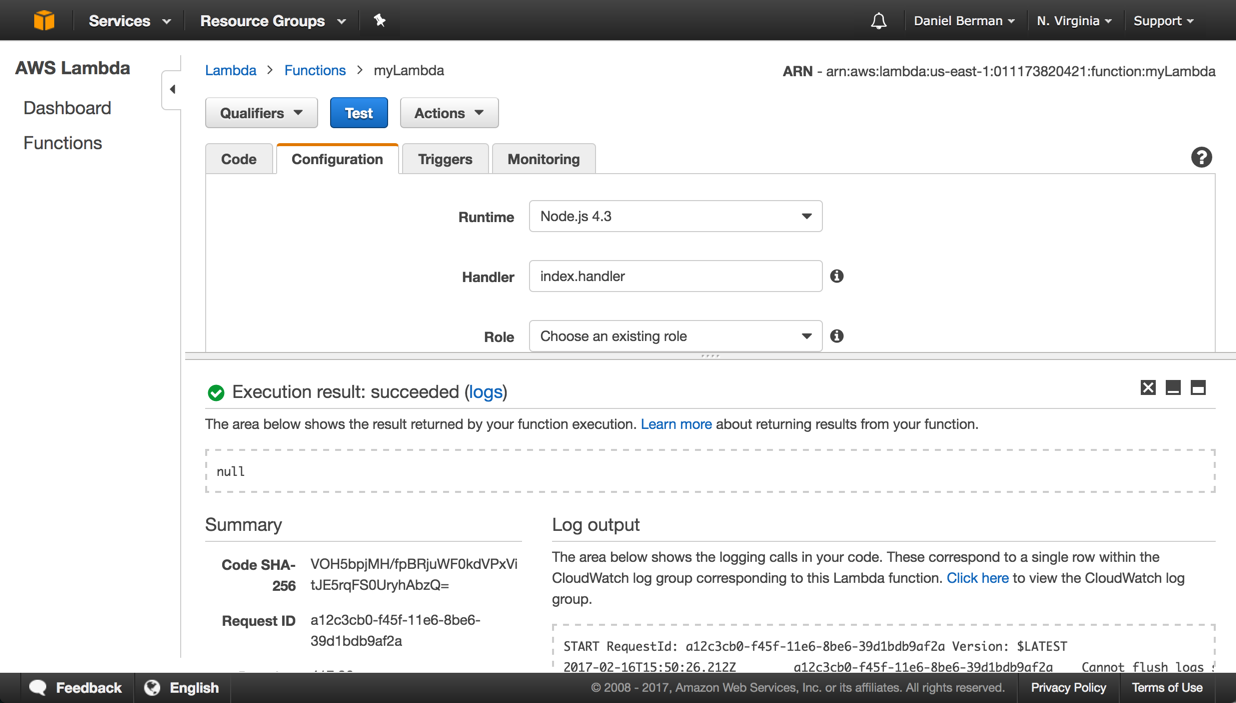
Continue on to the Review step. Make sure that all is correct and hit the Create function button.
The function is created and should begin to stream logs into Logz.io within a few minutes. To make sure that all is working as expected, hit the Test button:
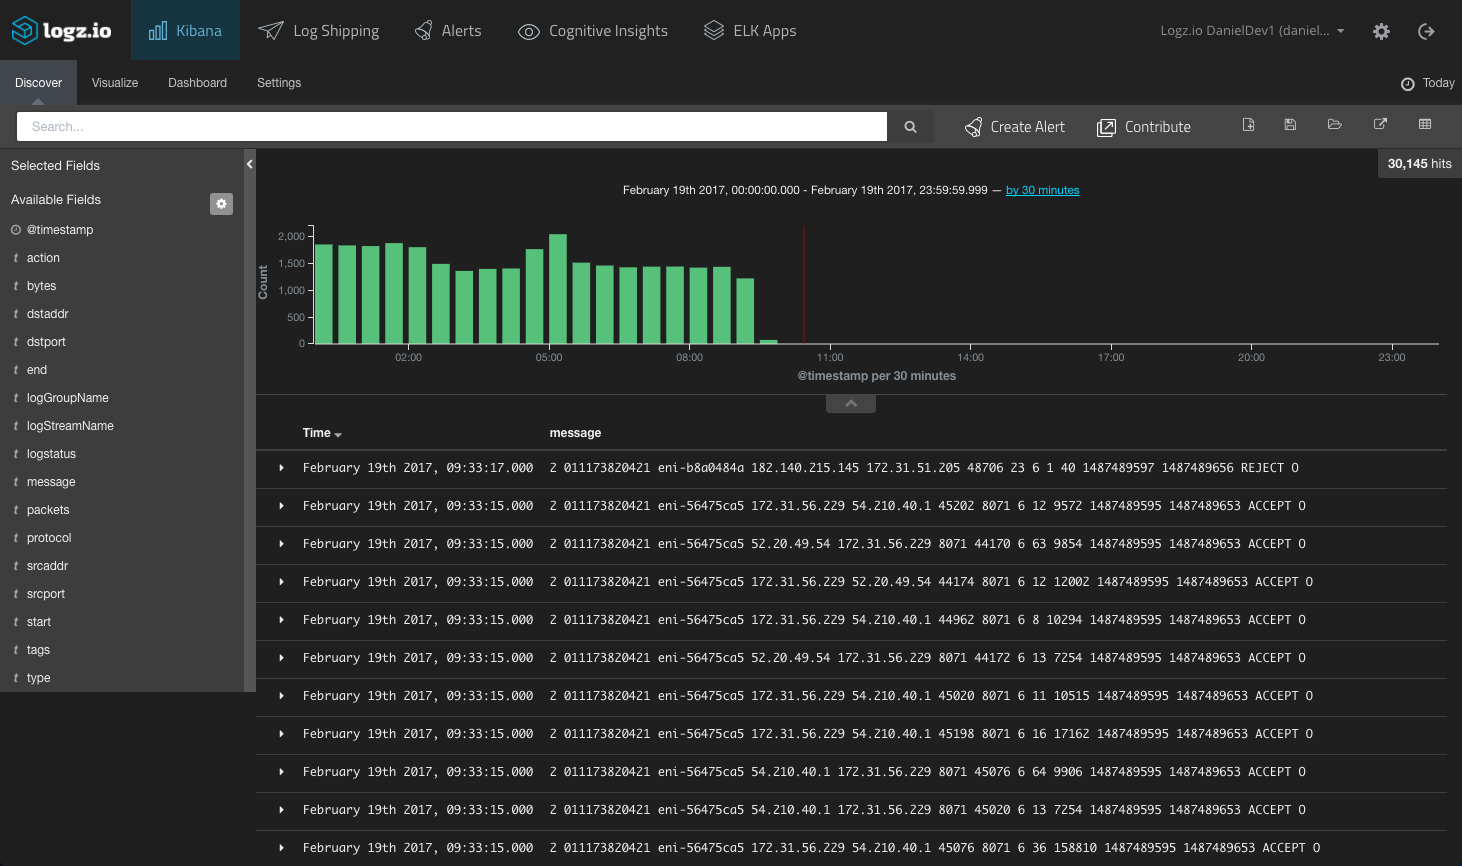
As mentioned, it may take a minute or two for the logs to show up in Kibana:
Building a VPC Flow Logs Dashboard
What’s left to do now is to build a dashboard that will help us to monitor the VPC Flow logs. To do this, we will build a series of visualizations for the data provided in the logs.
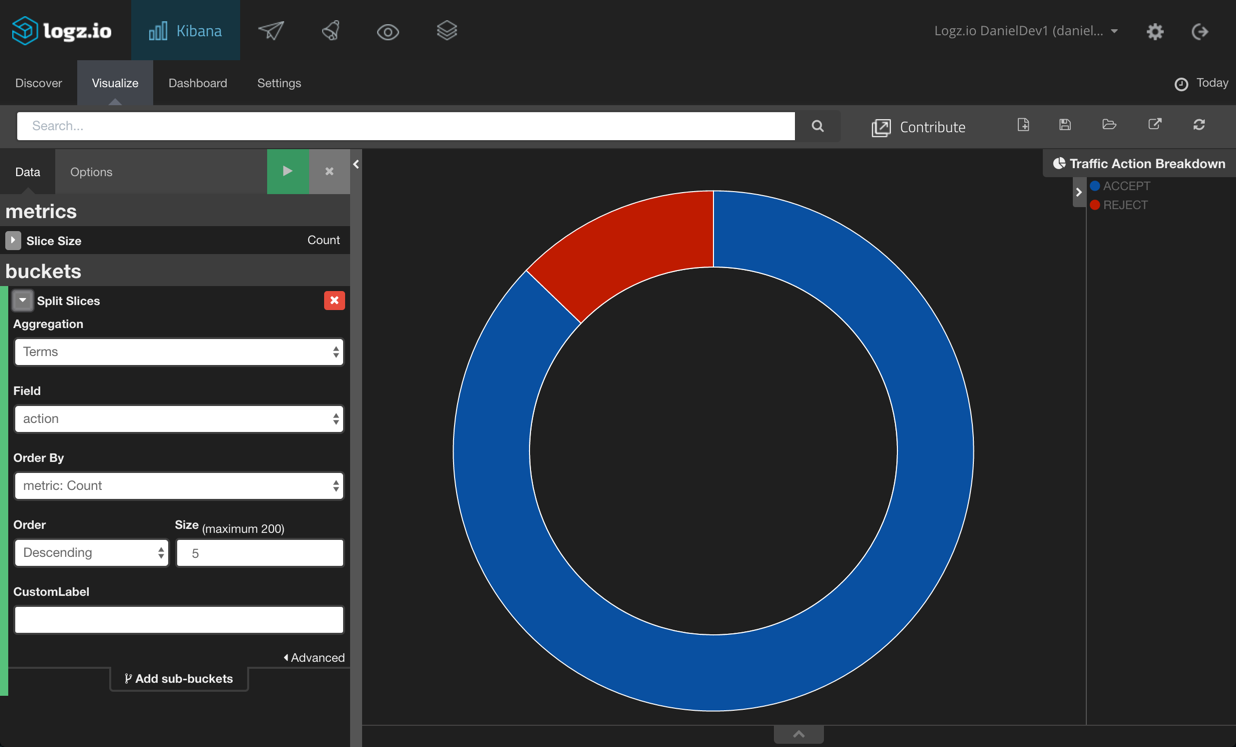
First, we will start with a simple pie chart visualization that will give us a breakdown of the actions associated with the traffic — ACCEPT or REJECT. To do this, we will use the Terms aggregation for the Action field:
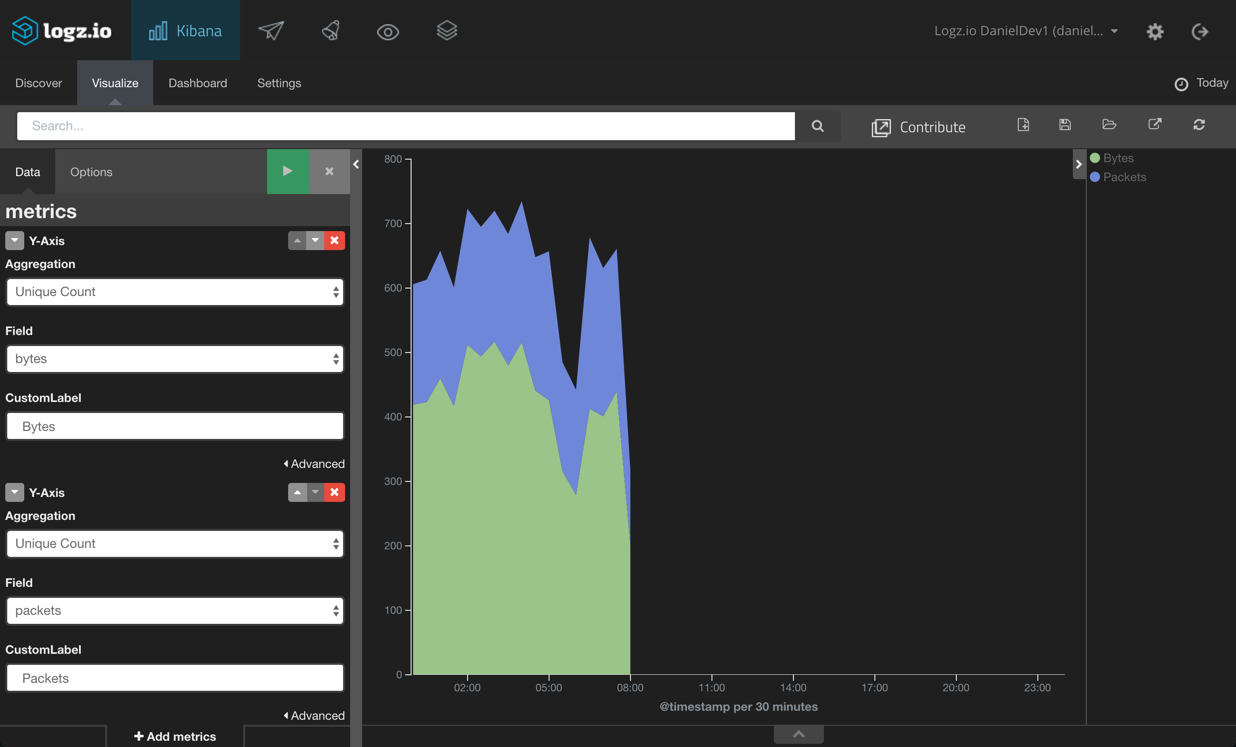
Next, we’re going to depict the flow of packets and bytes through the network. To do this, we will create an area chart visualization that will compare the unique count of the packets and bytesfields. Our X-axis is a time histogram:
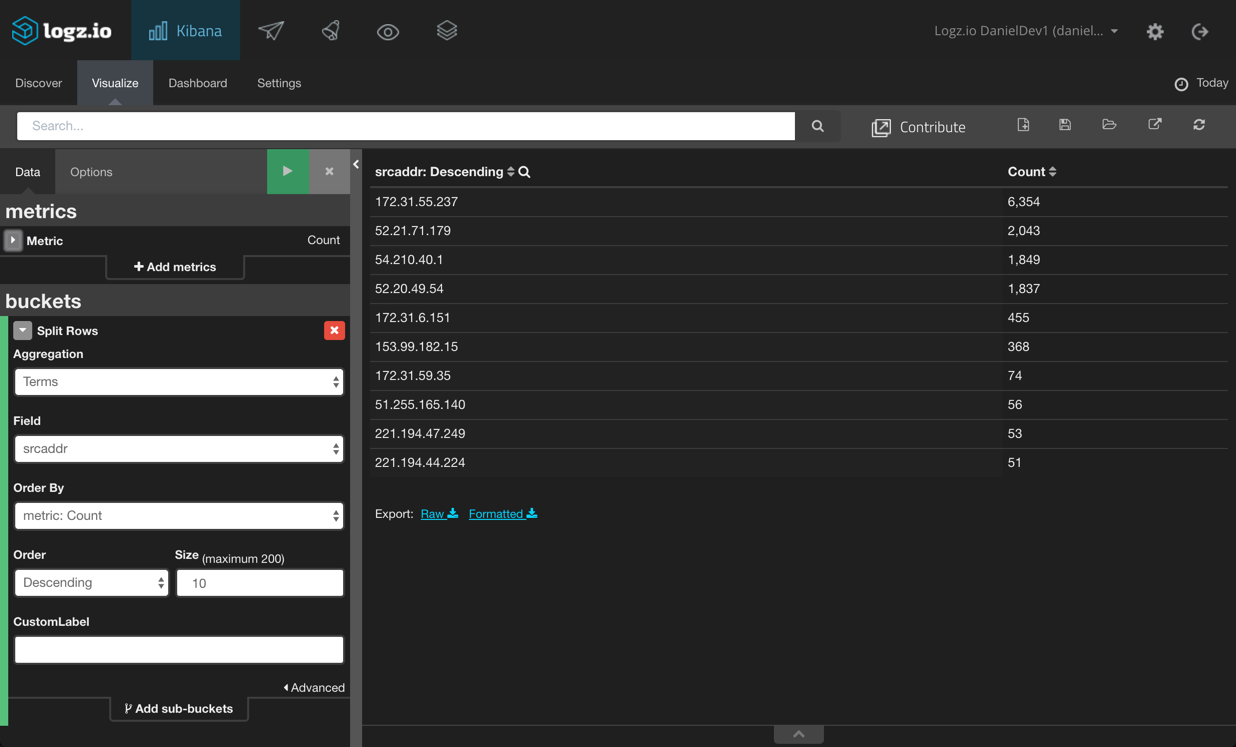
Next, let’s build some tables to give us a list of the top 10 source and destination IPv4 or IPv6 addresses. To do this, we’re going to use the data table visualization and use the srcaddr and destaddrfields:

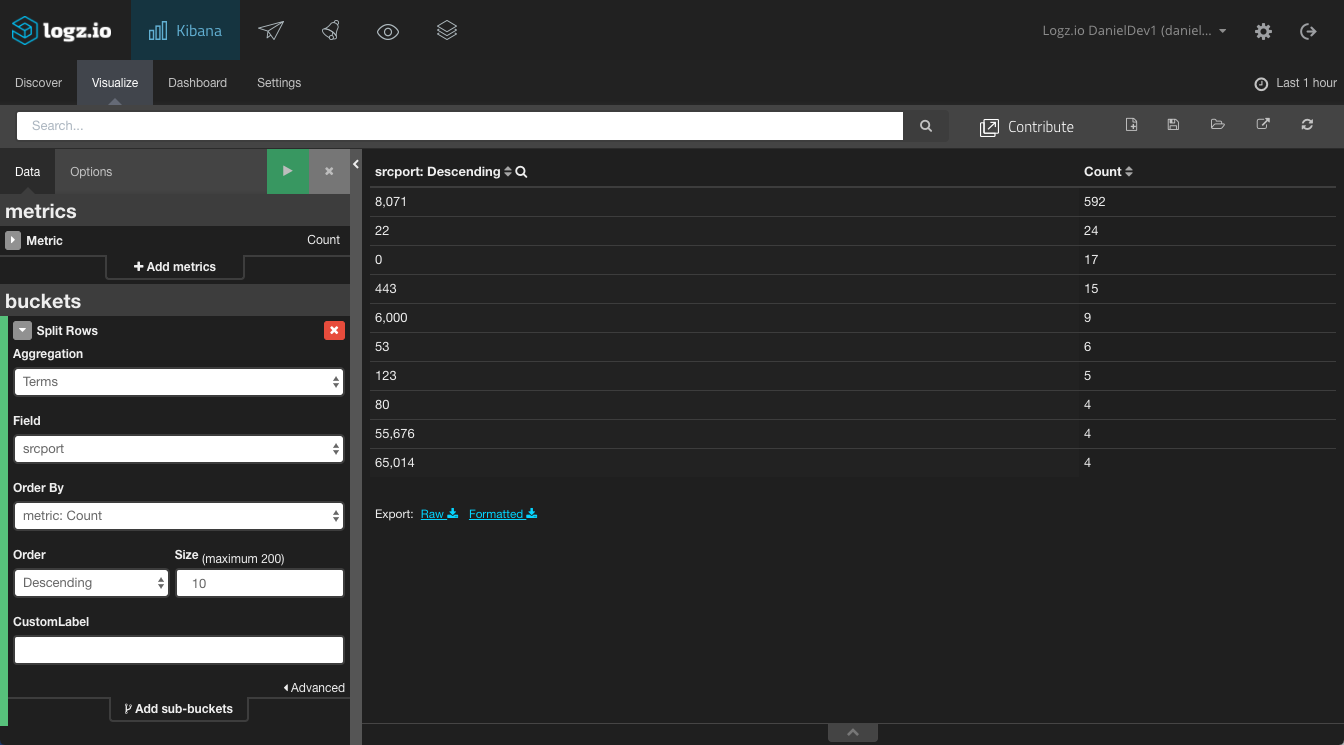
Same goes for the destination and source ports:

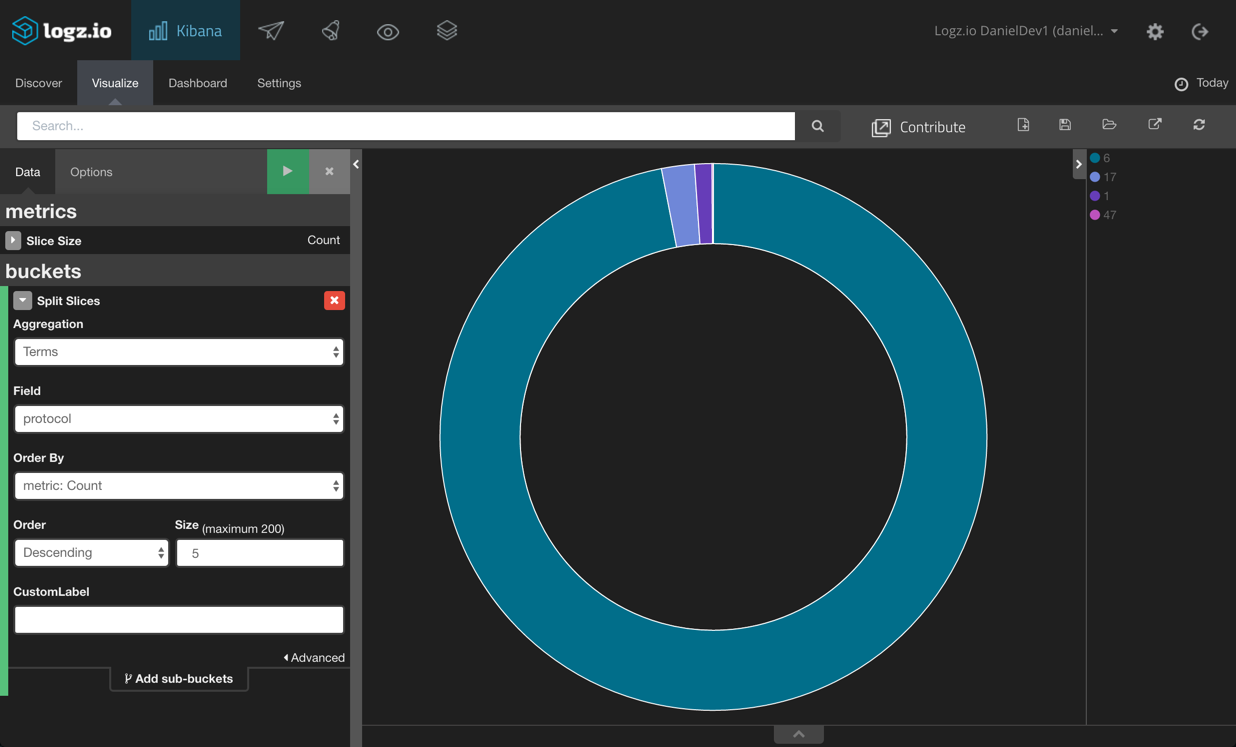
Last but not least, we’re going to create a pie chart visualization that gives a breakdown of the IANA protocol number for the traffic logged:
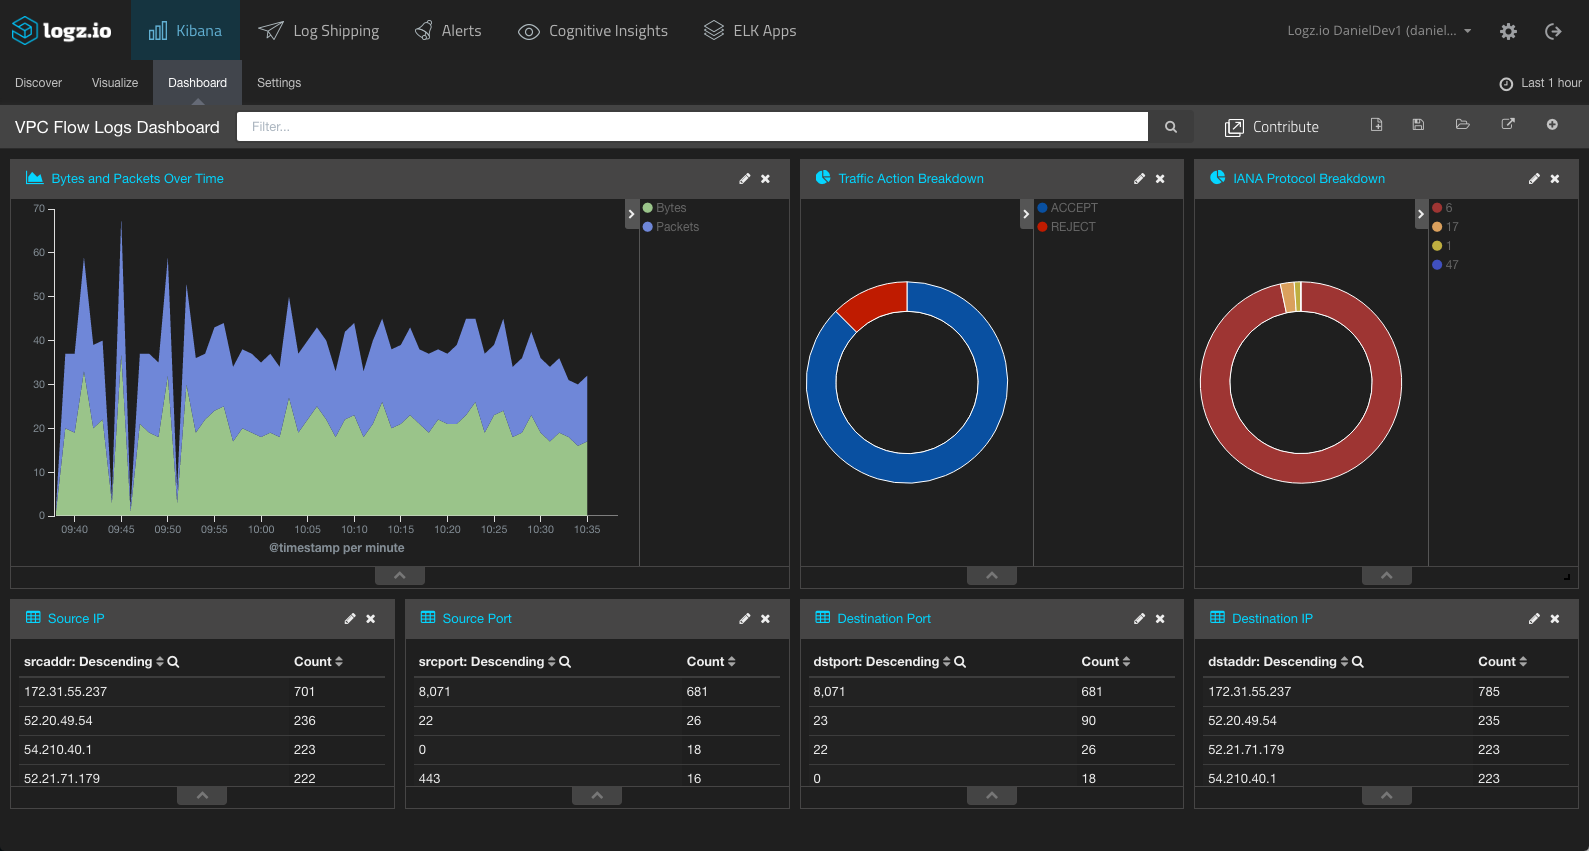
Combining all of these, we get a nice dashboard monitoring the VPC Flow logs:
You can also watch our video on how to set up alerts while monitoring the logs:
Summary
VPC Flow logs are a great source of information when trying to analyze and monitor IP traffic going to and from network interfaces in your VPC. The logs can be used in security to monitor what traffic is reaching your instances and in troubleshooting to diagnose why specific traffic is not being routed properly. Using ELK helps you to make sense of all the traffic data being shipped into CloudWatch from your VPC console.
The dashboard shown above is available for download from ELK Apps — the Logz.io library of pre-made Kibana visualizations, alerts, and dashboards for various log types.
As mentioned in the introduction, there are other ways of streaming logs from CloudWatch into ELK — namely, using Kinesis Firehose and CloudWatch subscriptions. We will cover this method in a future post.
Happy logging!
Published at DZone with permission of Daniel Berman. See the original article here.
Opinions expressed by DZone contributors are their own.
Comments