

What Is Agent Observability? Key Lessons Learned
A foundational guide to the key concepts of agent observability including best practices, metrics, and common challenges.
Join the DZone community and get the full member experience.
Join For FreeAgents are proliferating like wildfire, yet there is a ton of confusion surrounding foundational concepts such as agent observability. Is it the same as AI observability? What problem does it solve, and how does it work?
Fear not, we'll dive into these questions and more. Along the way, we will cite specific user examples as well as our own experience in pushing a customer-facing AI agent into production.
By the end of this article, you will understand:
- Best practices from real data + AI teams
- How the agent observability category is defined
- The benefits of agent observability
- The critical capabilities required for achieving those benefits
- Best practices from real data + AI teams
What Is an Agent?
Anthropic defines an agent as “LLMs autonomously using tools in a loop.”
I’ll expand on that definition a bit. An agent is an AI equipped with a set of guiding principles and resources, capable of a multi-step decision and action chain to produce a desired outcome. These resources often consist of access to databases, communication tools, or even other sub-agents (if you are using a multi-agent architecture).
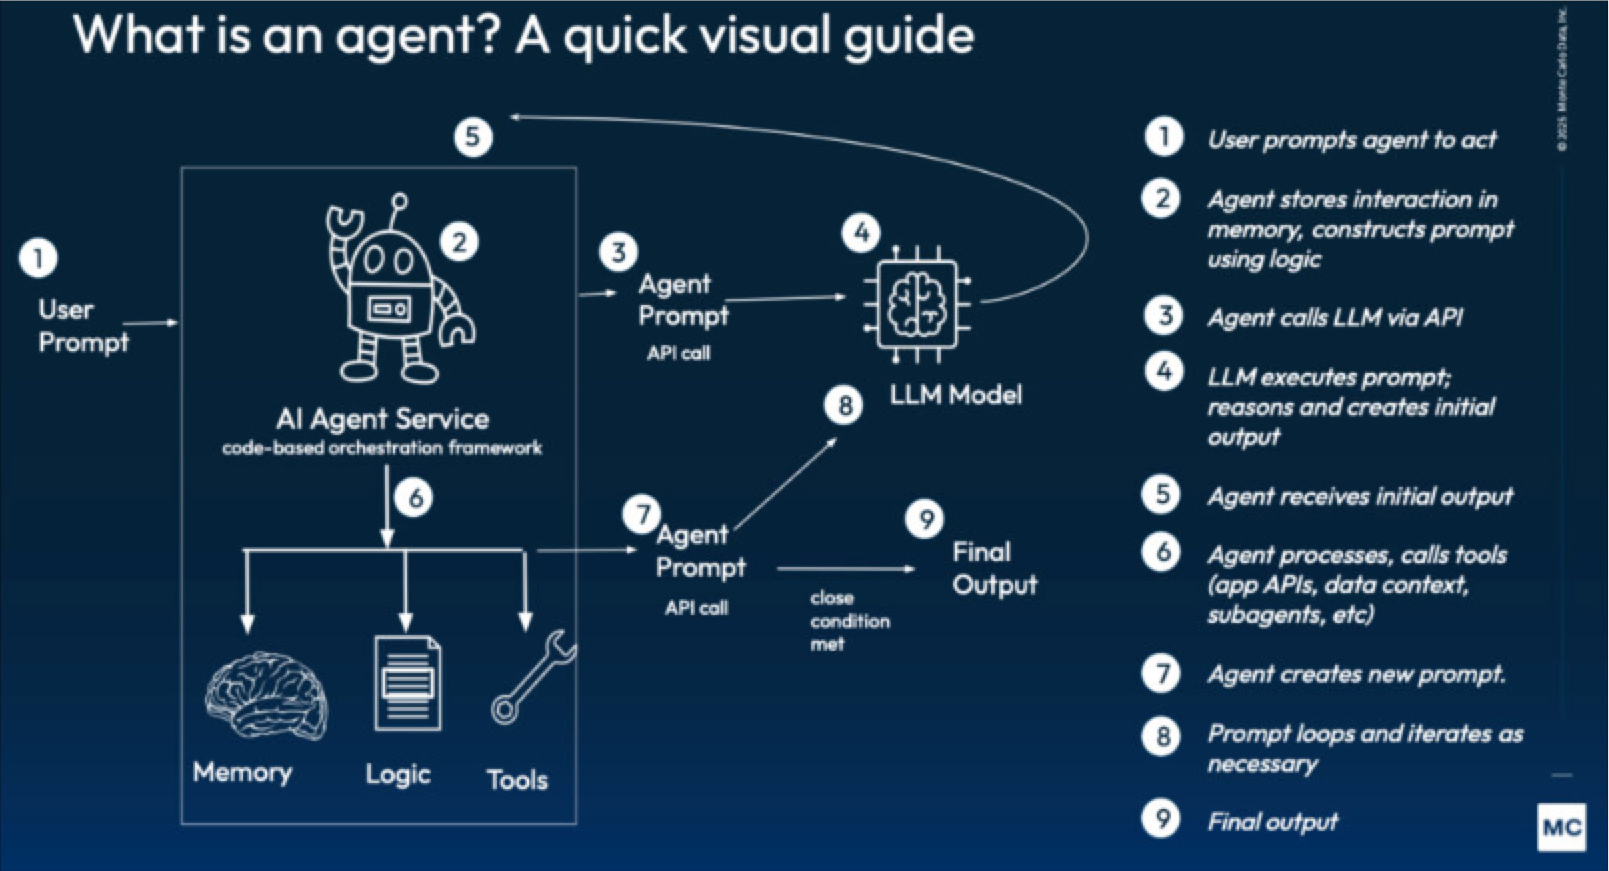
For example, a customer support agent may:
- Receive a user inquiry regarding a refund on their last purchase
- Create and escalate a ticket
- Access the relevant transaction history in the data warehouse
- Access the relevant refund policy chunk in a vector database
- Use the provided context and instructional prompt to formulate a response
- Reply to the user
And that would just be step one in the process! The user would reply creating another unique response and series of actions.
What Is Observability?
Observability is the ability to have visibility into a system's inputs and outputs, as well as the performance of its component parts.
An analogy I like to use is a factory that produces widgets. You can test the widgets to make sure they are within spec, but to understand why any deficiencies occurred, you also need to monitor the gears that make up the assembly line (and have a process for fixing broken parts).
There are multiple observability categories. The term was first introduced by platforms designed to help software engineers or site reliability engineers reduce the time their applications are offline. These solutions are categorized by Gartner in their Magic Quadrant for Observability Platforms.
Barr Moses introduced the data observability category in 2019. These platforms are designed to reduce data downtime and increase adoption of reliable data and AI. Gartner has produced a Data Observability Market Guide and given the category a benefit rating of HIGH. Gartner also projects 70% of organizations will adopt data observability platforms by 2027, an increase from 50% in 2025.
And amidst these categories, you also have agent observability. Let’s define it.
What Is Agent Observability?
If we combine the two definitions — what is an agent and what is observability — together, we get the following:
Agent observability is the ability to have visibility into the performance of the inputs, outputs, and component parts of an LLM system that uses tools in a loop.
It’s a critical, fast-growing category — Gartner projects that 90% of companies with LLMs in production will adopt these solutions.
Agent observability provides visibility into the agent lifecycle. Image courtesy of the author. Let’s revisit our customer success agent example to further flesh out this definition.
What was previously an opaque process with a user question, “Can I get a refund?” and agent response, “Yes, you are within the 30-day return window. Would you like me to email you a return label?” now might look like this:
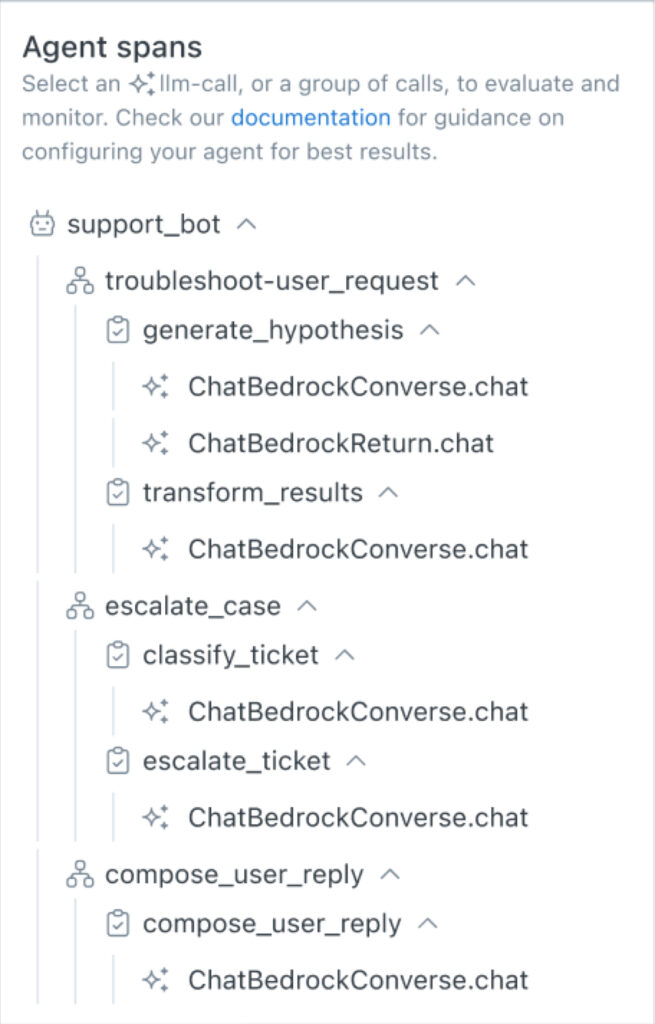
Sample trace visualized. Image courtesy of the author.
The above image is a visualized trace, or a record of each span (unit of work) the agent took as part of its session with a user. Many of these spans involve LLM calls. As you can see in the image below, agent observability provides visibility into the telemetry of each span, including the prompt (input), completion (output), and operational metrics such as token count (cost), latency, and more.
As valuable as this visibility is, what is even more valuable is the ability to set proactive monitors on this telemetry. For example, getting alerted when the relevance of the agent output drops or if the amount of tokens used during a specific span starts to spike.
We’ll dive into more details on common features, how it works, and best practices in subsequent sections, but first, let’s make sure we understand the benefits and goals of agent observability.
A Quick Note on Synonymous Categories
Terms like GenAI observability, AI observability, or LLM observability are often used interchangeably, although technically, the LLM is just one component of an agent.
RAG (retrieval-augmented generation) observability refers to a similar but less narrow pattern involving AI retrieving context to inform its response. I’ve also seen teams reference LLMops, AgentOps, or evaluation platforms.
The labels and technologies have evolved rapidly over a short period of time, but these categorical terms can be considered roughly synonymous. For example, Gartner has produced an “Innovation Insight: LLM Observability” report with essentially the same definition.
Honestly, there is no need to sweat the semantics. Whatever you or your team decide to call it, what’s truly important is that you have the technology and processes in place to monitor and improve the quality and reliability of your agent’s outputs.
Do You Need Agent Observability If You Use Guardrails?
The short answer is yes.
Many AI development platforms, such as AWS Bedrock, include real-time safeguards, called guardrails, to prevent toxic responses. However, guardrails aren’t designed to catch regressions in agent responses over time across dimensions such as accuracy, helpfulness, or relevance.
In practice, you need both working together. Guardrails protect you from acute risks in real time, while observability protects you from chronic risks that appear gradually. It’s similar to the relationship between data testing and anomaly detection for monitoring data quality.
Problem to Be Solved and Business Benefits
Ultimately, the goal of any observability solution is to reduce and minimize downtime.
This concept for software applications was popularized by the Google Site Reliability Engineering Handbook, which defined downtime as the portion of unsuccessful requests divided by the total number of requests.
Like everything in the AI space, defining a successful request is more difficult than it seems. After all these are non-deterministic systems meaning you can provide the same input many times and get many different outputs.
Is a request only unsuccessful if it technically fails? What about if it hallucinates and provides inaccurate information? What if the information is technically correct, but it’s in another language or surrounded by toxic language?
Again, it’s best to avoid getting lost in the semantics and pedantics. Ultimately, the goal of reducing downtime is to ensure features are adopted and provide the intended value to users.
This means agent downtime should be measured based on the underlying use case. For example, clarity and tone of voice might be paramount for our customer success chatbot, but it might not be a large factor for a revenue operations agent providing summarized insights from sales calls.
This also means your downtime metric should correspond to user adoption. If those numbers don’t track, you haven’t captured the key metrics that make your agent valuable.
Most data + AI teams I talk to today are using adoption as the main proxy for agent reliability. As the space begins to mature, teams are gradually moving toward more forward leading indicators such as downtime and the metrics that roll up to it such as relevancy, latency, recall (F1), and more.
Dropbox, for example, measures agent downtime as:
- Responses without a citation
- If more than 95% of responses have a latency greater than 5 seconds
- If the agent does not reference the right source at least 85% of the time (F1 > 85%)
- Factual accuracy, clarity, and formatting are other dimensions, but a failure threshold isn’t provided.
At Monte Carlo, our development team considers our Troubleshooting Agent as experiencing downtime based on the metrics of semantic distance, groundedness, and proper tool usage. These are evaluated on a 0-1 scale using an LLM-as-judge methodology. Downtime in staging is defined as:
- Any score under 0.5
- More than 33% of LLM-as-judge evaluations or more than 2 total evaluations score between a .5 and .8, even after an automatic retry.
- Groundedness tests show the agent invents information or answers out of scope (hallucination or missing context).
- The agent misuses or fails to use the required tools
Outside of adoption, agents can be evaluated across the classic business values of reducing cost, increasing revenue, or decreasing risk. In these scenarios, the cost of downtime can be quantified easily by taking the frequency and duration of downtime and multiplying them by the ROI being driven by the agent.
This formula remains mostly academic at the moment since, as we’ve noted previously, most teams are not as focused on measuring immediate ROI.
However, I have spoken to a few. One of the clearest examples in this regard is a pharmaceutical company using an agent to enrich customer records in a master data management match-merge process.
They originally built their business case on reducing cost, specifically the number of records that need to be enriched by human stewards. However, while they did increase the number of records that could be automatically enriched, they also improved a large number of poor records that would have been automatically discarded as well!
So the human steward workload actually increased! Ultimately, this was a good result as record quality improved; however, it does underscore how fluid and unpredictable this space remains.
How Agent Observability Works
Agent observability can be built internally by engineering teams or purchased from several vendors. We’ll save the build vs. buy analysis for another time, but, as with data testing, some smaller teams will choose to start with an internal build until they reach a scale where a more systemic approach is required.
Whether an internal build or vendor platform, when you boil it down to the essentials, there are really two core components to an agent observability platform: trace visualization and evaluation monitors.
Trace Visualization
Traces, or telemetry data that describes each step taken by an agent, can be captured using an open-source SDK that leverages the OpenTelemetry (Otel) framework.
Teams label key steps — such as skills, workflows, or tool calls — as spans. When a session starts, the agent calls the SDK, which captures all the associated telemetry for each span, such as model version, duration, tokens, etc.
A collector then sends that data to the intended destination (we think the best practice is to consolidate within your warehouse or lakehouse source of truth), where an application can then help visualize the information, making it easier to explore.
One benefit to observing agent architectures is that this telemetry is relatively consolidated and easy to access via LLM orchestration frameworks, as compared to observing data architectures, where critical metadata may be spread across a half dozen systems.
Evaluation Monitors
Once you have all of this rich telemetry in place, you can monitor or evaluate it. This can be done using an agent observability platform, or sometimes the native capabilities within data + AI platforms.
Teams will typically refer to the process of using AI to monitor AI (LLM-as-judge) as an evaluation. This type of monitor is well-suited to evaluate the helpfulness, validity, and accuracy of the agent. This is because the outputs are typically larger text fields and non-deterministic, making traditional SQL-based monitors less effective across these dimensions.
Where SQL code-based monitors really shine, however, is in detecting issues across operational metrics (system failures, latency, cost, throughput) as well as situations in which the agent’s output must conform to a very specific format or rule. For example, if the output must be in the format of a US postal address, or if it must always have a citation.
Most teams will require both types of monitors. In cases where either approach will produce a valid result, teams should favor code-based monitors as they are more deterministic, explainable, and cost-effective.
However, it’s important to ensure your heuristic or code-based monitor is achieving the intended result. Simple code-based monitors focused on use case-specific criteria — say, output length must be under 350 characters–are typically more effective than complex formulas designed to broadly capture semantic accuracy or validity, such as ROUGE, BLEU, cosine similarity, and others.
While these traditional metrics benefit from being explainable, they struggle when the same idea is expressed in different terms. Almost every data science team starts with these familiar monitors, only to quickly abandon them after a rash of false positives.
What About Context Engineering and Reference Data?
This is arguably the third component of agent observability.
It can be a bit tricky to draw a firm line between data observability and agent observability — it's probably best not to even try.
This is because agent behavior is driven by the data it retrieves, summarizes, or reasons over. In many cases, the “inputs” that shape an agent’s responses — things like vector embeddings, retrieval pipelines, and structured lookup tables — sit somewhere between the two worlds. Or perhaps it may be more accurate to say they all live in one world, and that agent observability MUST include data observability.
This argument is pretty sound. After all, an agent can’t get the right answer if it’s fed wrong or incomplete context — and in these scenarios, agent observability evaluations will still pass with flying colors.
Challenges and Best Practices
It would be easy enough to generate a list of agent observability challenges teams could struggle with, but let’s take a look at the most common problems teams are actually encountering. And remember, these are challenges specifically related to observing agents.
Challenge #1: Evaluation Cost
LLM workloads aren’t cheap, and a single agent session can involve hundreds of LLM calls. Now imagine for each of those calls you are also calling another LLM multiple times to judge different quality dimensions. It can add up quickly.
One data + AI leader confessed to us that their evaluation cost was 10 times as expensive as the baseline agent workload. Monte Carlo’s agent development team strives to maintain roughly a one to one workload to evaluation ratio.
Best Practices to Contain Evaluation Cost
Most teams will sample a percentage or an aggregate number of spans per trace to manage costs while still retaining the ability to detect performance degradations. Stratified sampling, or sampling a representative portion of the data, can be helpful in this regard. Conversely, it can also be helpful to filter for specific spans, such as those with a longer-than-average duration.
Challenge #2: Defining Failure and Alert Conditions
Even when teams have all the right telemetry and evaluation infrastructure in place, deciding what actually constitutes “failure” can be surprisingly difficult.
To start, defining failure requires a deep understanding of the agent’s use case and user expectations. A customer support bot, a sales assistant, and a research summarizer all have different standards for what counts as “good enough.”
What’s more, the relationship between a bad response and its real-world impact on adoption isn’t always linear or obvious. For example, if an evaluation model gives a response that is judged to be a .75 for clarity, is that a failure?
Best Practices for Defining Failure and Alert Conditions
Aggregate multiple evaluation dimensions. Rather than declaring a failure based on a single score, combine several key metrics — such as helpfulness, accuracy, faithfulness, and clarity — and treat them as a composite pass/fail test. This is the approach Monte Carlo takes in our agent evaluation framework for our internal agents.
Most teams will also leverage anomaly detection to identify a consistent drop in scores over a period of time rather than a single (possibly hallucinated) evaluation. Dropbox, for example, leverages dashboards that track their evaluation score trends over hourly, six-hour, and daily intervals.
Finally, know which monitors are “soft” and which are “hard.” Some monitors should immediately trigger an alert when their threshold is breached. Typically, these are more deterministic monitors evaluating an operational metric such as latency or a system failure.
Challenge #3: Flaky Evaluations
Who evaluates the evaluators? Using a system that can hallucinate to monitor a system that can hallucinate has obvious drawbacks.
The other challenge for creating valid evaluations is that, as every single person who has put an agent into production has bemoaned to me, small changes to the prompt have a large impact on the outcome. This means creating customized evaluations or experimenting with evaluations can be difficult.
Best Practices for Avoiding Flaky Evaluations
Most teams avoid flaky tests or evaluations by testing extensively in staging on golden datasets with known input-output pairs. This will typically include representative queries that have proved problematic in the past.
It is also a common practice to test evaluations in production on a small sample of real-world traces with a human in the loop.
Of course, LLM judges will still occasionally hallucinate. Or as one data scientist put it to me, “one in every ten tests spits out absolute garbage.” He will automatically rerun evaluations for low scores to confirm issues.
Challenge #4: Visibility Across the Data + AI Lifecycle
Of course, once a monitor sends an alert, the immediate next question is always: “Why did that fail?” Getting the answer isn’t easy! Agents are highly complex, interdependent systems.
Finding the root cause requires end-to-end visibility across the four components that introduce reliability issues into a data + AI system: data, systems, code, and model. Here are some examples:
Data
- Real-world changes and input drift. For example, if a company enters a new market and there are now more users speaking Spanish than English. This could impact the language the model was trained in.
- Unavailable context. We recently wrote about an issue where the model was working as intended but the context on the root cause (in this case a list of recent pull requests made on table queries) was missing.
System
- Pipeline or job failures
- Any change to what tools are provided to the agent or changes in the tools themselves.
- Changes to how the agents are orchestrated
Code
- Data transformation issues (changing queries, transformation models)
- Updates to prompts
- Changes impacting how the output is formatted
Model
- Platform updates its model version
- Changes to which model is used for a specific call
Best Practices for Visibility Across the Data + AI Lifecycle
It is critical to consolidate telemetry from your data + AI systems into a single source of truth, and many teams are choosing the warehouse or lakehouse as their central platform. This unified view lets teams correlate failures across domains — for example, seeing that a model’s relevancy drop coincided with a schema change in an upstream dataset or an updated model.
Deep Dive: Example Architecture
The image above shows the technical architecture that Monte Carlo’s Troubleshooting Agent leverages to build a scalable, secure, and decoupled system that connects its existing monolithic platform to its new AI Agent stack.
On the AI side, the AI Agent Service runs on Amazon ECS Fargate, which enables containerized microservices to scale automatically without managing underlying infrastructure. Incoming traffic to the AI Agent Service is distributed through a network load balancer (NLB), providing high-performance, low-latency routing across Fargate tasks.
The image below is an abstracted interpretation of the Troubleshooting Agent’s workflow, which leverages several specialized sub-agents. These sub-agents investigate different signals to determine the root cause of a data quality incident and report back to the managing agent, who presents the findings to the user.
Deliver Production-Ready Agents
The core takeaway I hope you walk away with is that when your agents enter production and become integral to business operations, the ability to assess their reliability becomes a necessity. Production-grade agents must be observed.
This article was co-written with Michael Segner.
Published at DZone with permission of Lior Gavish. See the original article here.
Opinions expressed by DZone contributors are their own.
Comments