One of the key purposes of using a centralized monitoring framework is that it can help you quickly identify and mitigate issues across your entire Kubernetes deployment. It is also important to note that monitoring a distributed cluster not only requires monitoring components and services, but also visibility of all cluster characteristics of the system.
As a result, it is crucial to build a central system that offers valuable insights by aggregating both tangible and intangible data from multiple sources. This can help you generate usability trends and measure anomalous patterns that would otherwise be difficult to spot.
Capture Monitoring Data Insights
Some common approaches to capture monitoring data insights include Golden Signals, the RED Method, and the USE Method.
Golden Signals
These represent vital performance indicators that offer valuable insights into the overall performance of your system. They include:
- Latency – time taken for a request to be processed by the system to help identify potential performance issues
- Errors – number of errors per second being generated by the system to help identify potential problems with the application or infrastructure
- Saturation – degree to which the system is being utilized to help identify whether additional capacity is required
- Traffic – number of requests per second being handled by the system to help identify potential bottlenecks
While Golden Signals can be used to monitor any type of system, it is particularly well suited for monitoring more general metrics that are captured through liveness probes.
The RED Method
In contrast to Golden Signals, the RED Method uses liveness and readiness probes to determine whether a pod or the overall deployment is healthy. This allows for more granular, user-controlled performance visibility of individual containers as well as the applications and services that they power. The Red Method also offers a robust set of features for managing alerts and notifications, offering users more control over when and how they are notified of issues with their clusters.
Metrics captured through this approach include:
- Rate – requests a service can handle in a given period
- Error – number of failed requests in a given period
- Duration – latency or time taken by each request
The USE Method
While Golden Signals and the RED approach monitor overall system health, the USE Method helps track how resources are being used within the system. Metrics captured through the USE Method include:
- Utilization – degree to which the system is being utilized
- Saturation – degree by which the system requires additional resources for completing a task
- Error – rate of error in a given period
As the USE Method relies on data collected from within the Kubernetes cluster, the approach can provide more accurate and detailed insights of a Kubernetes cluster. Additionally, the USE Method is built to work with multiple data sources and can help track changes over time by generating trends and patterns of a working cluster.
Leverage Kubernetes Components for Monitoring
Besides adopting different approaches to capture metrics, it is equally important to adopt the right approach to monitor a Kubernetes cluster. To ascertain this, it is crucial to weigh the various factors such as cluster complexity, workload types, and the granularity level on which monitoring is to be administered.
Kubernetes Metrics Server
The Metrics Server is a Kubernetes component that aggregates resource usage data from all nodes in a cluster. By default, the Metrics Server does not collect any data itself; rather, it relies on individual nodes to push their own metrics to the server through kubelets. These metrics are pushed to the Kubernetes API Server and can be further monitored through kubectl top commands, or they can be exposed to the Kubernetes Dashboard for monitoring and tracking resource utilization.
In addition to collecting node-level resource usage data, the Metrics Server can also be used to troubleshoot performance issues and capacity planning for applications running on top of Kubernetes. This can be achieved by instrumenting workloads with one of the supported exporters (such as Prometheus), and then exposing application-level metrics to the Metrics Server for querying and visualization of resource usage.
DaemonSets With Monitoring Agents
One of the key features of Kubernetes is its ability to run DaemonSets, which are sets of pods that are guaranteed to be running on all nodes in the cluster. Leveraging the Kubernetes DaemonSets with monitoring agents for cluster monitoring can provide a comprehensive solution for keeping tabs on your system. By taking advantage of the inherent parallelism of DaemonSets, you can run multiple instances of your monitoring agent on each node for redundancy, consequently ensuring that there's always a working copy of the agent available.
This approach also has the benefit of being highly scalable since adding more nodes to your cluster will automatically add more copies of the agent, which ensures that no matter how many nodes are added or removed from the cluster, there will always be at least one agent running on each node.
Monitoring clusters through DaemonSets offers several advantages:
- The approach ensures that there is always data being collected from every node in the cluster, which is essential for detecting anomalies early on.
- Because the monitoring agents themselves are deployed on Kubernetes, they can easily be scaled up or down without impacting the rest of the system.
Identify Key Metrics for Monitoring Kubernetes
As a Kubernetes cluster grows in scale and complexity, so too does the importance of observing resource utilization. Thankfully, Kubernetes offers a variety of utilization metrics that can help you gain insights into the health and performance of your applications. These include the following featured metrics.
Cluster State Metrics
Cluster state metrics provide a high-level overview of the health of a Kubernetes cluster. While these metrics can be used to determine how well the system is performing as a whole and identify potential aspects of performance optimization, cluster state metrics are mostly used as the first step toward analyzing deeper anomalies of a system.
A typical approach is to use cluster state metrics to assess an overview of the system, and then use more specific metrics (such as network latency metrics) to identify root cause and take corrective action.
Key cluster state metrics to monitor include:
- Cluster size
- Pod count
- Node count
- Deployment count
Node State Metrics
Node state metrics provide an overview of the status of each node in a Kubernetes cluster. They can be used to monitor the health of nodes and identify any issues that may be affecting their performance. The most important node state metric is CPU utilization, which can be used to determine if a node is underutilized or overloaded.
Other important metrics include:
- Memory usage
- Disk space
- Network traffic
Pod Availability
These include the number/percentage of pods that are available, the average time to recover from a pod failure, and more. There are a number of pod availability metrics that can be used for Kubernetes monitoring, including:
|
Metric |
Description |
|
Pod ready |
Percentage of pods that are ready and available to receive traffic; a high pod ready percentage indicates a healthy cluster |
|
Pod failed |
Percentage of pods that have failed; a high pod failed percentage indicates an unhealthy cluster |
|
Pod restarts |
Number of times a pod has been restarted; a high number of restarts indicates an unstable cluster |
|
Pod age |
Age of a pod; a high pod age indicates a stale or outdated cluster |
Disk Utilization
Disk utilization metrics for Kubernetes monitoring provide visibility into the health of your Kubernetes cluster by offering insights on how much disk space is being used. When monitoring disk utilization, there are a few key metrics to keep track of, including:
|
Metric |
Description |
|
Utilized storage space |
Indicates the size of the data files and any accompanying metadata to help identify services that may lead to strained capacity in the future |
|
Disk read/write rate |
Indicates the rate at which data is being read from or written to disk |
|
Disk latency |
Indicates high latency that can lead to slowdowns and capacity overrun |
CPU Utilization
Considered one of the core metrics of Kubernetes monitoring, CPU utilization metrics help identify issues that may lead to suboptimal computing and its underlying causes. Some key CPU utilization metrics include:
|
Metric |
Description |
|
CPU cores |
Number of processing cores being used by an app or container to help identify if underlying workloads are using the optimal number of cores |
|
CPU usage |
Amount of time that a process or thread is using the CPU |
|
CPU idle time |
Amount of time the CPU is idle; an unusual (high or low) percentage of idle time indicates inefficient resource allocation and utilization |
Memory Utilization
Memory utilization can be affected by a number of factors, including container density, pod memory limits, and application memory usage. By monitoring memory utilization metrics, you can identify out-of-memory errors proactively and prevent them from becoming performance bottlenecks.
Some key memory utilization metrics include:
|
Metric |
Description |
|
Overall memory usage |
General overview of how much memory the Kubernetes system is using |
|
Memory usage per pod |
Memory consumption of each individual pod in a system |
|
Memory usage per node |
Amount of memory each node in a Kubernetes system is consuming |
|
Memory pressure |
Indicates if the system is struggling to keep enough free memory available for other services to operate |
|
Available memory |
Amount of memory available for new apps or cluster operations |
API Request Latency
API request latency metrics are one of the key performance indicators (KPIs) for any Kubernetes deployment that help track if workloads are responsive and performing as expected for end users or services. There are a few different metrics that you can use to measure API request latency:
|
Metric |
Description |
|
Median API request latency |
Time taken for half of all API requests to be processed to get an overall sense of a cluster's performance |
|
95th percentile API request latency |
Time taken for 95% of all API requests to be processed to identify potential bottlenecks |
|
99th percentile API request latency |
Time taken for 99% of all API requests to be processed to help identify severe bottlenecks of a cluster |
Monitor Core Components and Services of Kubernetes
Kubernetes is supported by different components and services that work together to provide a unified platform for running containerized applications. When monitoring Kubernetes, it is a common approach to identify the core components and services that support its ecosystem. Some critical components and services to monitor in Kubernetes include the control plane and worker nodes, as shown in Figure 1:
Figure 1: Key components and services of a Kubernetes architecture
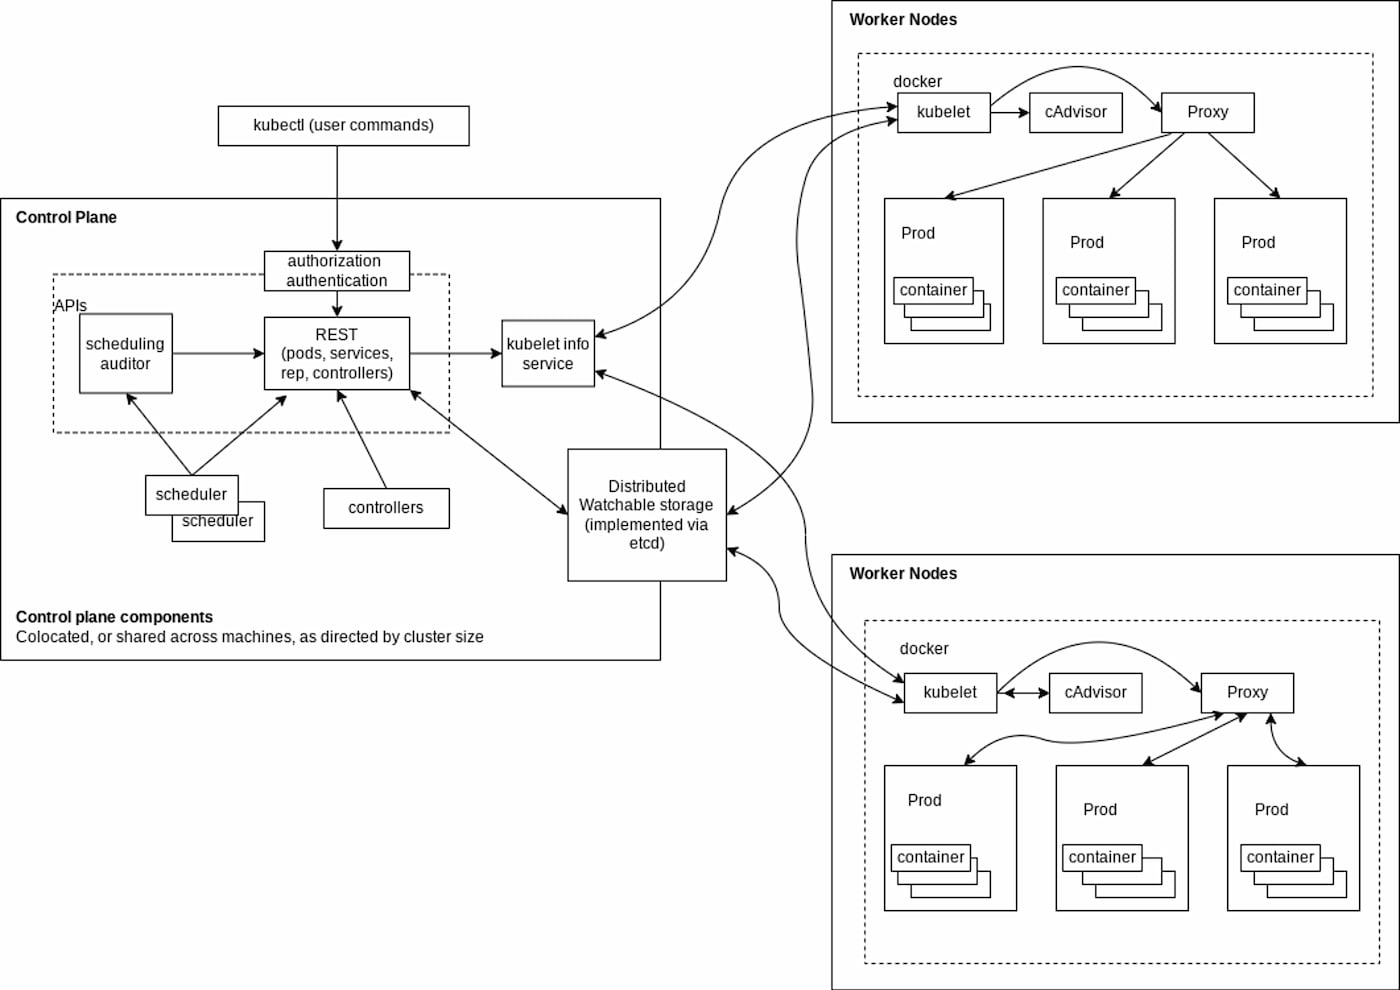 Control Plane
Known as the brain of a Kubernetes cluster, the control plane coordinates operations of all other nodes (referred to as worker nodes) of the cluster. The control plane is also responsible for handling all the cluster's communications with the outside world through APIs.
A control plane further comprises a number of components, including:
- Etcd – As Kubernetes uses the etcd distributed key-value store for storing all cluster data, it is one of the most critical components that should be monitored for optimum performance and availability. To monitor etcd, a common approach is to check for errors in the logs or use automated tools to verify that data is being replicated across servers to maintain high availability (HA).
- API Server – The Kubernetes API server acts as the central point of communication for all components within and external to the system, which needs to be responsive at all times of cluster operations. To monitor its health, a typical approach is to detect errors in the logs and make sure that all API calls are returning timely responses.
- Scheduler – As the scheduler is responsible for assigning pods onto nodes, it is crucial to ensure workloads are running where they should be. Monitoring the scheduler helps verify if pods are being scheduled onto the correct nodes.
- Controller manager – A controller manager is responsible for running one or more controllers, which are essentially background processes that oversee the state of a cluster. To ensure controllers are scalable and highly available as the cluster grows, it is crucial to monitor the behavior of both individual controllers and the controller manager.
Worker Nodes
Worker nodes are standalone machines of a Kubernetes cluster that run applications and store underlying data. Monitoring worker nodes helps troubleshoot issues affecting hosted applications and identify performance bottlenecks. Key services of worker nodes include:
- Kubelet – Performs basic tasks such as starting and stopping containers, collecting log files, and managing storage. In addition, the kubelet also makes sure that containers are running the correct version of application code. Monitoring worker nodes with the kubelet helps ensure all pods on the node are appropriately assigned and are operating without resource-level conflicts.
- Container runtimes – Are used to launch and manage containers in a cluster. Kubernetes uses container runtimes to manage its pods, which are groups of containers that need to be co-located and co-scheduled on a host. Besides troubleshooting performance issues, monitoring runtimes also helps track compliance and detect security vulnerabilities.
- Kube-proxy – Monitoring kube-proxy helps inspect service connectivity and ensure that all nodes are able to communicate with each other. This can be especially important when you are rolling out updates as any issues with kube-proxy can cause uneven distribution of traffic between nodes.