Chaos Engineering: Simulating CPU Spikes
Let's discuss how to simulate CPU consumption to spike up to 100% on a host (or container). CPU consumption will spike up whenever a thread goes on an infinite loop.
Join the DZone community and get the full member experience.
Join For FreeIn this series of chaos engineering articles, let's discuss how to simulate CPU consumption to spike up to 100% on a host (or container). CPU consumption will spike up whenever a thread goes on an infinite loop. Here is a sample program from the open-source BuggyApp application, which would cause the CPU to spike up.
public class CPUSpikeDemo {public static void start() {new CPUSpikerThread().start();new CPUSpikerThread().start();new CPUSpikerThread().start();new CPUSpikerThread().start();new CPUSpikerThread().start();new CPUSpikerThread().start();System.out.println("6 threads launched!");}} public class CPUSpikerThread extends Thread {@Overridepublic void run() {while (true) {// Just looping infinitely}}}
In the above Java program, you will notice the 'CPUSpikeDemo' class. In this class, 6 threads with the name 'CPUSpikerThread' are launched. If you notice the 'CPUSpikerThread' class code, there is a 'while (true)' loop without any code in it. This condition will cause the thread to go on an infinite loop. Since 6 threads are executing this code, all the 6 threads will go on an infinite loop. When this program is executed, CPU consumption will skyrocket on the machine.
We launched the above BuggyApp program on a 't3a.medium' EC2 instance, which has 2 CPUs. Below is the output from the UNIX performance monitoring tool 'top'. You can notice the overall CPU % reaching up to 100%.

Fig: Top tool showing CPU consumption spiking up to 100%.
How to Diagnose CPU Spikes?
As highlighted in this article, you can use a manual approach to do root cause analysis:
- Capture thread dump from the application.
- Capture '
top -H -p {PID}' output. - Marry these #a and #b and identify the root cause of the CPU spike problem.
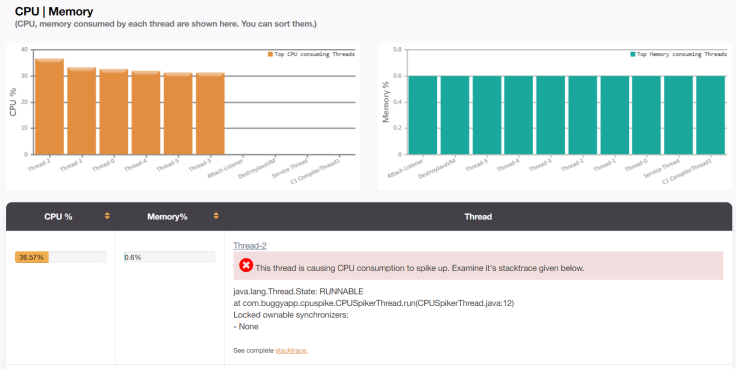
On the other hand, you can use automated root cause analysis tool like yCrash — which automatically captures application-level data (thread dump, heap dump, Garbage Collection log), system-level data (netstat, vmstat, iostat, top, top -H, dmesg, …) and marries these two datasets to generate instant root cause analysis report instantly. Below is the report generated by the yCrash tool when the above sample program is executed:


Fig: yCrash tool point outlines of code causing the CPU spike.
From the report, you can observe the yCrash is pointing out that 6 threads are causing the CPU to spike up. In the 'CPU | Memory' section of this report, you will notice that the CPU consumption of each thread (which is > 30%) is being reported. You can also notice that tool is pointing out exact lines of code, i.e., com.buggyapp.cpuspike.CPUSpikerThread.run(CPUSpikerThread.java:12) that are causing the infinite loop. Equipped with this information, one can easily go ahead and fix the problematic code.
Opinions expressed by DZone contributors are their own.

Comments