Create CloudWatch Custom Log Metric Alarm Notification Email Solution Using Terraform
Readers will use a tutorial to learn how to create a CloudWatch custom log metric alarm notification using Terraform, including code and guide visuals.
Join the DZone community and get the full member experience.
Join For FreeAmazon CloudWatch metric alarm allows customers to watch a metric value, or a math expression value for the metric, and trigger actions when the value breaks a certain threshold limit. These alarms can be used to trigger notifications delivered via Amazon SNS, email, SMS, etc. It has been a requirement for customers to include the application log messages in the alarm notification message, so it becomes easier for operational staff to identify the root cause for the alarm notification. In this article, I will demonstrate how to embed the application log messages in the notification email body when the CloudWatch alarm is activated.
Prerequisites
- AWS account
- Terraform installed and ready to use.
Product Versions
- HashiCorp Terraform: v0.13 or later
- Python: v3.9 or later
- Node.js: 14.x or later
Target Architecture
The following architecture diagram shows the components involved in this solution and the interaction between them.
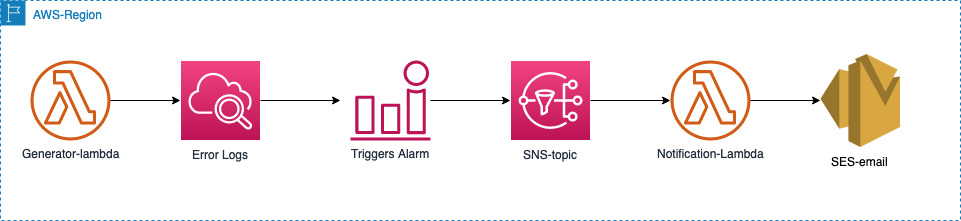
- Generator-Lambda: Generates error and fatal logs, which are pushed to the CloudWatch logs.
- Error Logs: The metric filter counts the occurrence of errors when the error message matches the configured pattern.
- Triggers Alarm: When the count exceeds the threshold configured, the CloudWatch Alarm is activated and pushes a message to the SNS-topic.
- SNS-topic: The message in the SNS topic invokes the Notification-Lambda.
- Notification-Lambda: Extracts the error message from CloudWatch and embeds it in the HTML email body and sends an email using SES.
Code Samples
Here is the code for the Lambda code for generator-lambda written in Python. Running this Lambda will generate CloudWatch logs:
import os
import json
from datetime import datetime


def lambda_handler(event, context):
    # name of lambda function - app-lambda-test
    now = datetime.now()
    dt_string = now.strftime("%Y-%m-%s %H:%M:%S")
    print ("Lambda starting execution: ", now)

    print('Finding environment configuration')

    print ("rds_user_secret_id:", "rds_user_secret_id")
    print ("db_endpoint:", "db_endpoint")

    print('FATAL ERROR')
    print('Sample Error')

    rows = []
    return {
        'statusCode' : 200,
        'body' : json.dumps(event, indent=4)
   }
The Lambda function must be assigned the following permission to execute successfully:
"logs:CreateLogGroup",
"logs:CreateLogStream",
"logs:PutLogEvents"
The following code is used to create the SNS topic:
#Create SNS Topic for CloudWatch Alarm Action that will sent alarm active event to the SNS topic
module "sns" {
  source            = "terraform-aws-modules/sns/aws"
  version           =  "3.3.0"
  name              = format("%s-cw-alarm", "sns-topic")

}
The following code is used to create the CloudWatch metric filter and alarm for the FATAL ERROR. This alarm will be triggered if the error occurs one time in a period of five minutes:
#Create CloudWatch Log Metric Filter that counts 'FATAL ERROR' string match in the CW log group specified.
resource "aws_cloudwatch_log_metric_filter" "fatal-error-metric-filter-log" {
  name           = "bootstrap-fatal-error"
  pattern        = "FATAL ERROR"
  log_group_name = aws_cloudwatch_log_group.generator-log-group.name

  metric_transformation {
    name      = "bootstrap-fatal-error"
    namespace = "bootstrap-app"
    value     = "1"
    default_value = "0"
    unit = "Count"
  }
}

#Create CloudWatch Metric Alarm for custom metric
resource "aws_cloudwatch_metric_alarm" "fatal_error_alarm" {
  alarm_name          = "bootstrap_custom_metric_alarm"
  comparison_operator = "GreaterThanOrEqualToThreshold"
  evaluation_periods  = "1"
  metric_name         = "bootstrap-fatal-error"
  namespace           = "bootstrap-app"
  period              = "300"
  statistic           = "Sum"
  unit = "Count"
  threshold                                            = "1"
  alarm_description   = "This metric monitors fatal errors in logs"
  actions_enabled     = "true"
  alarm_actions       = [module.sns.sns_topic_arn] #use the sns topic arn of the above sns topic

}
The following code is used to create the CloudWatch metric filter and alarm for the Sample Error. This alarm will be triggered if the error occurs two times in a consecutive period of one minute each:
#Create CloudWatch Log Metric Filter that counts 'Error' string match the CW log group specified.
resource "aws_cloudwatch_log_metric_filter" "metric-filter-log" {
  name           = "bootstrap-error"
  pattern        = "Error"
  log_group_name = aws_cloudwatch_log_group.generator-log-group.name

  metric_transformation {
    name      = "bootstrap-error"
    namespace = "bootstrap-app"
    value     = "1"
    default_value = "0"
    unit = "Count"
  }
}

#Create CloudWatch Metric Alarm for the CW Log Metric Filter custom metric
resource "aws_cloudwatch_metric_alarm" "error_alarm" {
  alarm_name          = "bootstrap_error_custom_metric_alarm"
  comparison_operator = "GreaterThanOrEqualToThreshold"
  metric_name         = aws_cloudwatch_log_metric_filter.metric-filter-log.name
  namespace           = "bootstrap-app"
  evaluation_periods  = "2" #two continuous evaluation periods if threshold is crossed, alarm will be enabled.
  period              = "60"
  statistic           = "Sum"
  unit = "Count"
  threshold                                            = "2"
  treat_missing_data = "notBreaching"
  alarm_description   = "This metric monitors non-fatal errors in logs"
  actions_enabled     = "true"
  alarm_actions       = [module.sns.sns_topic_arn]
}
Here is the Lambda code for the notification-lambda written in Node.js to send the email with the log content. The To_Email and From_Email environment variable values should be provided to the IaC during execution. The email addresses must be verified from SES console to receive emails:
var aws = require('aws-sdk');
var cwl = new aws.CloudWatchLogs();

var ses = new aws.SES();

exports.lambda_handler = function(event, context) {
    var message = JSON.parse(event.Records[0].Sns.Message);
    var alarmName = message.AlarmName;
    var oldState = message.OldStateValue;
    var newState = message.NewStateValue;
    var reason = message.NewStateReason;
    var requestParams = {
        metricName: message.Trigger.MetricName,
        metricNamespace: message.Trigger.Namespace
    };
    cwl.describeMetricFilters(requestParams, function(err, data) {
        if(err) console.log('Error is:', err);
        else {
            console.log('Metric Filter data is:', data);
            getLogsAndSendEmail(message, data);
        }
    });
};


function getLogsAndSendEmail(message, metricFilterData) {
    var timestamp = Date.parse(message.StateChangeTime);
    var offset = message.Trigger.Period * message.Trigger.EvaluationPeriods * 1000;
    var metricFilter = metricFilterData.metricFilters[0];
    var parameters = {
        'logGroupName' : metricFilter.logGroupName,
        'filterPattern' : metricFilter.filterPattern ? metricFilter.filterPattern : "",
         'startTime' : timestamp - offset,
         'endTime' : timestamp
    };
    cwl.filterLogEvents(parameters, function (err, data){
        if (err) {
            console.log('Filtering failure:', err);
        } else {
            console.log("===SENDING EMAIL===");

            var email = ses.sendEmail(generateEmailContent(data, message), function(err, data){
                if(err) console.log(err);
                else {
                    console.log("===EMAIL SENT===");
                    console.log(data);
                }
            });
        }
    });
}

function generateEmailContent(data, message) {
    var events = data.events;
    console.log('Events are:', events);
    var style = '<style> pre {color: red;} </style>';
    var logData = '<br/>Logs:<br/>' + style;
    for (var i in events) {
        logData += '<pre>Instance:' + JSON.stringify(events[i]['logStreamName'])  + '</pre>';
        logData += '<pre>Message:' + JSON.stringify(events[i]['message']) + '</pre><br/>';
    }

    var date = new Date(message.StateChangeTime);
    var text = 'Alarm Name: ' + '<b>' + message.AlarmName + '</b><br/>' +
               'Runbook Details: <a href="http://wiki.mycompany.com/prodrunbook">Production Runbook</a><br/>' +
               'Account ID: ' + message.AWSAccountId + '<br/>'+
               'Region: ' + message.Region + '<br/>'+
               'Alarm Time: ' + date.toString() + '<br/>'+
               logData;
    var subject = 'Details for Alarm - ' + message.AlarmName;
    var emailContent = {
        Destination: {
            ToAddresses: [process.env.TO_EMAIL]
        },
        Message: {
            Body: {
                Html: {
                    Data: text
                }
            },
            Subject: {
                Data: subject
            }
        },
        Source: process.env.FROM_EMAIL
    };

    return emailContent;
}
The notification-lambda functions should have the following permissions assigned to it:
"SES:sendEmail", "logs:CreateLogGroup", "logs:CreateLogStream", "logs:PutLogEvents", "logs:DescribeMetricFilters", "logs:filterLogEvents"Conclusion
This simple solution, if implemented correctly, will help the operational resources get an idea about the failure by looking at the logs embedded in the email. The dev team does not need to add any additional codes for this solution. The metric filters and alarm rules can be customized easily based on the business requirement. The email sent will batch all the errors that come in the configured amount of time (look for the variable offset in the notification-lambda code), and it will prevent spamming the ops personnel’s inbox.
Opinions expressed by DZone contributors are their own.
Comments