Dashboards vs. Reports: Which Do You Need?
What's the difference between dashboards and reports? Many organizations view them interchangeably but ignore the distinct advantages and disadvantages each offer.
Join the DZone community and get the full member experience.
Join For FreeIt's a fact that today's organizations need data to thrive and expand. No matter the industry or field, understanding ecosystems, stakeholders, and clients can help companies make better decisions, act more decisively, and cut down on resource waste. There is more than one way to view and present data, though, and the best reporting tool depends on an organization's needs. Even so, there are two main ways BI tools provide information to organizations: dashboards and reports.
The question is, what's the difference between the two? Many organizations view them interchangeably but ignore the distinct advantages and disadvantages each offer. Understanding each and what they bring to the table can help you determine which one fits your organization's needs best. These are some of the key differences between each and how you can choose the right tool to satisfy your organization's demands.
What Are Reports?
Reports are static documents that contain data in text and table form. They sometimes include visuals such as basic graphs and charts but are mostly organized to highlight specific raw numbers or relevant datasets. Reports are usually delivered to various stakeholders periodically, which means data isn't live. One of the attributes of reports is that they allow the creator to build full narratives with data and optimize its presentation. Additionally, they feature data that is already cleaned, sorted, and parsed.
For users who don't have direct access to dashboards or analytic tools, they're also a major source of data. However, the data they supply isn't updated in real-time, and generally represents a slice of the available sets without the ability to manipulate them. Moreover, they can be extensive and complicated to create. For organizations with multiple departments and diverse data needs, reports can become time-consuming.
What Are Dashboards?
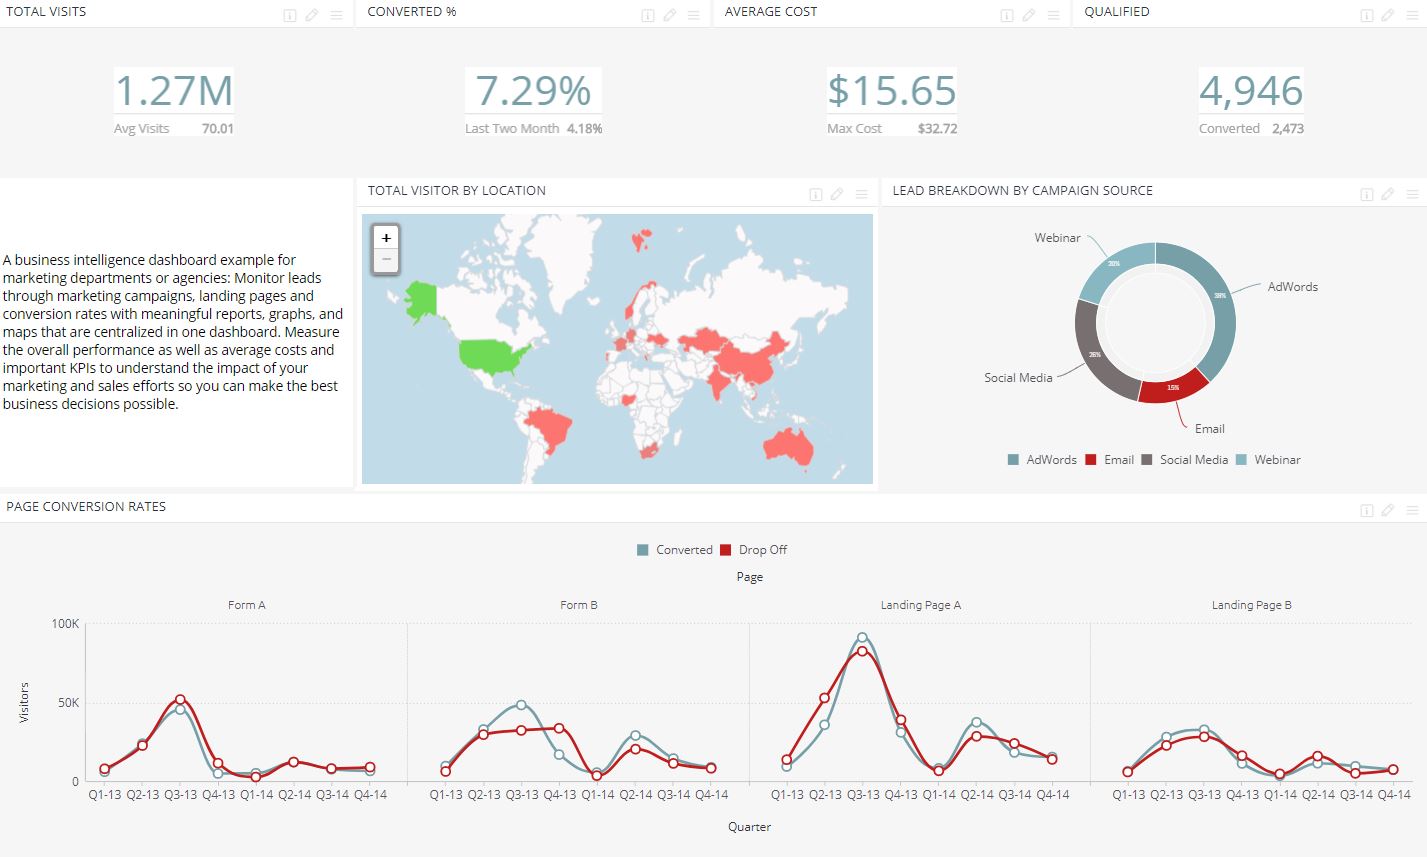
Dashboards are data visualization tools that can be customized and tailored to display specific metrics, data, and KPIs. Usually, these tools are dynamic and live, so data is being updated in real-time and visuals can show changes from minute to minute. Additionally, dashboards can be as narrow or broad as needed, letting organizations create multiple specific dashboards to better organize their analytics.
Where once dashboards were reserved for upper management, with the development of self-service analytics, every department across an organization can have access to relevant data. Dashboards can be broad and overarching or can focus on more narrow aspects of an organization. For example, human resources may have several specific dashboards for payroll, bonuses, and other functions, while a marketing department can have dashboards for advertising, website traffic, and average lead score.
So, Which Do I Need? Dashboards or Reports?
The answer to this question depends on what your specific data needs are. Both reports and dashboards offer key benefits, and each is accompanied by their own limitations. The first major area where each offers a different advantage is in scope. Dashboards can really include any number of data points and sets, though they are best employed when they focus on specific aspects of an organization. Some dashboard examples include tools that track help desk tickets, relative market share, investment portfolios, and other specific metrics.
Reports, on the other hand, have the benefit of a broader scope. Because they're not live and can be curated, reports can offer a better high-level view of an organization. A manager or CEO may not need to see specific dashboards for customer support, but he would benefit from understanding how the whole customer service department is operating.
The second key difference in each is data timeliness. Reports tend to be broader and feature historic data. Because they must be delivered periodically, they represent a snapshot of a specific area or organization rather than its real-time situation. Dashboards, on the other hand, are built to visualize and organize data in real-time. They can be modified to alert users when specific metrics change, or thresholds are met.
Finally, dashboards also allow users to manipulate and interact with data dynamically, whereas reports show a static picture of the existing data. Generally, dashboards are optimal for everyday analytics and BI needs, while reports are useful to capture static data. Furthermore, dashboards are ideal for compartmentalization and better monitoring of specific metrics and functions.
In the end, which reporting tool you use depends on what you need at the moment. Dashboards are unique in their dynamic and interactive abilities, as well as their timely updates. Reports provide a clearer high-level view of the cost of live data. In the end, they're both useful tools when necessary.
Published at DZone with permission of Shelby Blitz. See the original article here.
Opinions expressed by DZone contributors are their own.
Comments