Front-End Debugging Part 2: Console.log() to the Max
Learn advanced front-end debugging: use console log levels, CSS styles, assertions, and more to simplify and enhance your development workflow.
Join the DZone community and get the full member experience.
Join For FreeIn my previous post, I talked about why Console.log() isn’t the most effective debugging tool. In this installment, we will do a bit of an about-face and discuss the ways in which Console.log() is fantastic. Let’s break down some essential concepts and practices that can make your debugging life much easier and more productive.
Front-End Logging vs. Back-End Logging
Front-end logging differs significantly from back-end logging, and understanding this distinction is crucial. Unlike back-end systems, where persistent logs are vital for monitoring and debugging, the fluid nature of front-end development introduces different challenges. When debugging backends, I’d often go for tracepoints, which are far superior in that setting. However, the frontend, with its constant need to refresh, reload, contexts switch, etc., is a very different beast. In the frontend, relying heavily on elaborate logging mechanisms can become cumbersome.
While tracepoints remain superior to basic print statements, the continuous testing and browser reloading in front-end workflows lessen their advantage. Moreover, features like logging to a file or structured ingestion are rarely useful in the browser, diminishing the need for a comprehensive logging framework. However, using a logger is still considered best practice over the typical Console.log for long-term logging. For short-term logging Console.log has some tricks up its sleeve.
Leveraging Console Log Levels
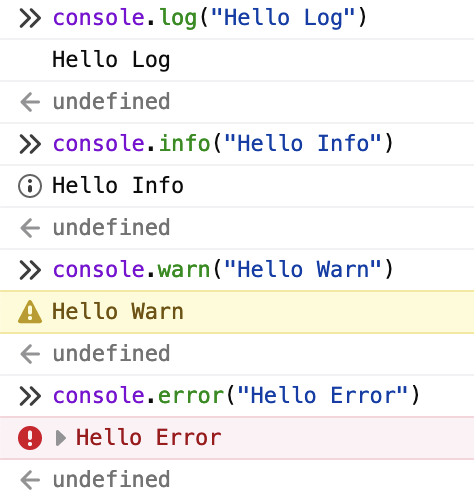
One of the hidden gems of the browser console is its support for log levels, which is a significant step up from rudimentary print statements. The console provides five levels:
- log: Standard logging
- debug: Same as log but used for debugging purposes
- info: Informative messages, often rendered like log/debug
- warn: Warnings that might need attention
- error: Errors that have occurred
While log and debug can be indistinguishable, these levels allow for a more organized and filtered debugging experience. Browsers enable filtering the output based on these levels, mirroring the capabilities of server-side logging systems and allowing you to focus on relevant messages.
Customizing Console Output With CSS
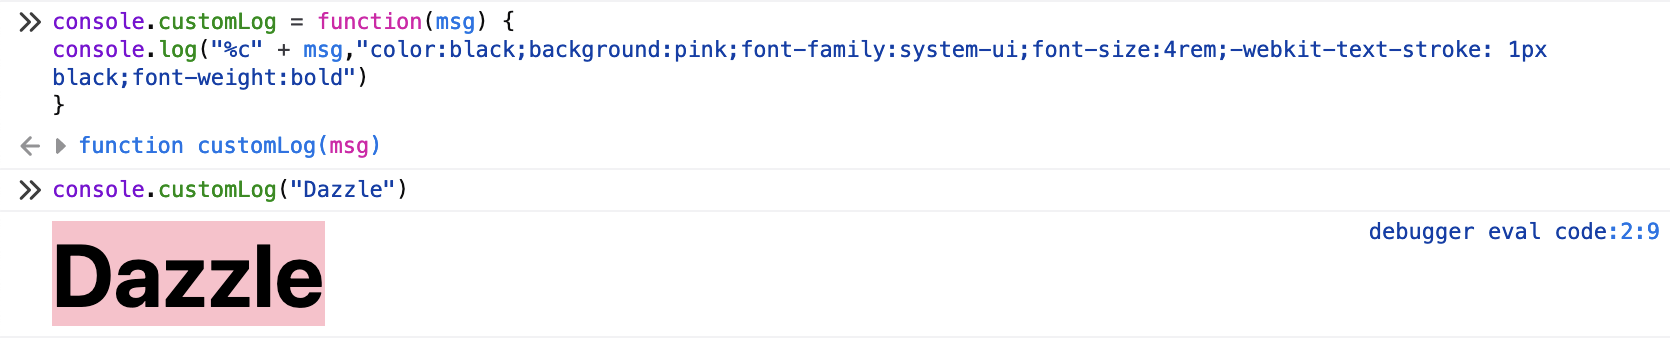
Front-end development allows for creative solutions, and logging is no exception. Using CSS styles in the console can make logs more visually distinct. By utilizing %c in a console message, you can apply custom CSS:
console.customLog = function(msg) {
    console.log("%c" + msg,"color:black;background:pink;font-family:system-ui;font-size:4rem;-webkit-text-stroke: 1px black;font-weight:bold")
}
console.customLog("Dazzle")
This approach is helpful when you need to make specific logs stand out or organize output visually. You can use multiple %c substitutions to apply various styles to different parts of a log message.
Stack Tracing With console.trace()
The console.trace() method can print a stack trace at a particular location, which can sometimes be helpful for understanding the flow of your code. However, due to JavaScript’s asynchronous behavior, stack traces aren’t always as straightforward as back-end debugging. Still, it can be quite valuable in specific scenarios, such as synchronous code segments or event handling.
Assertions for Design-by-Contract
Assertions in front-end code allow developers to enforce expectations and promote a “fail-fast” mentality. Using Console.assert(), you can test conditions:
console.assert(x > 0, 'x must be greater than zero');In the browser, a failed assertion appears as an error, similar to console.error. An added benefit is that assertions can be stripped from production builds, removing any performance impact. This makes assertions a great tool for enforcing design contracts during development without compromising production efficiency.

Printing Tables for Clearer Data Visualization
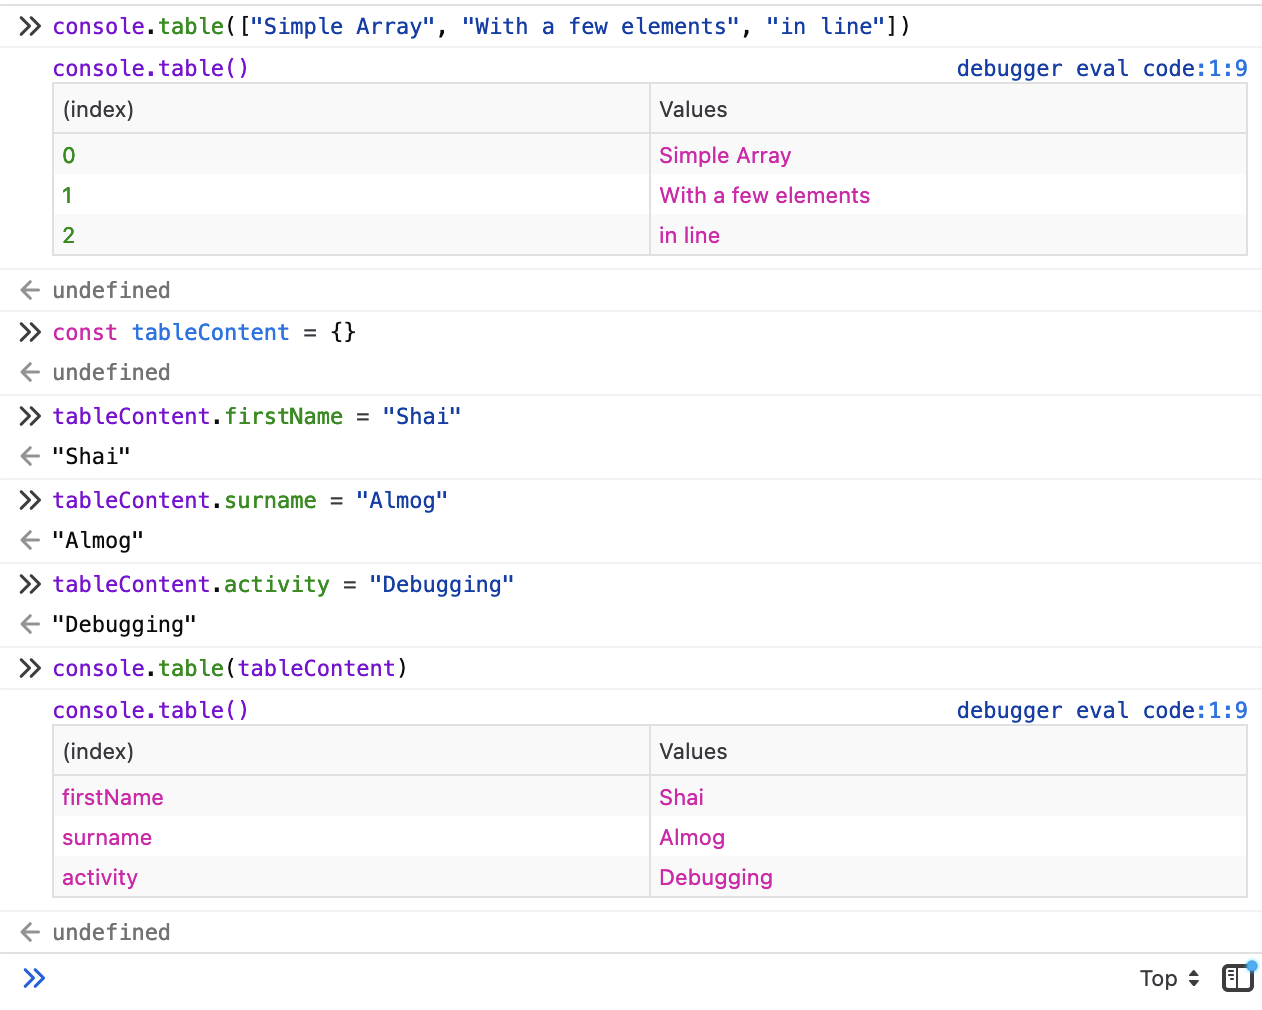
When working with arrays or objects, displaying data as tables can significantly enhance readability. The console.table() method allows you to output structured data easily:
console.table(["Simple Array", "With a few elements", "in line"])This method is especially handy when debugging arrays of objects, presenting a clear, tabular view of the data and making complex data structures much easier to understand.
Copying Objects to the Clipboard
Debugging often involves inspecting objects, and the copy(object) method allows you to copy an object’s content to the clipboard for external use. This feature is useful when you need to transfer data or analyze it outside the browser.
Inspecting With console.dir() and dirxml()
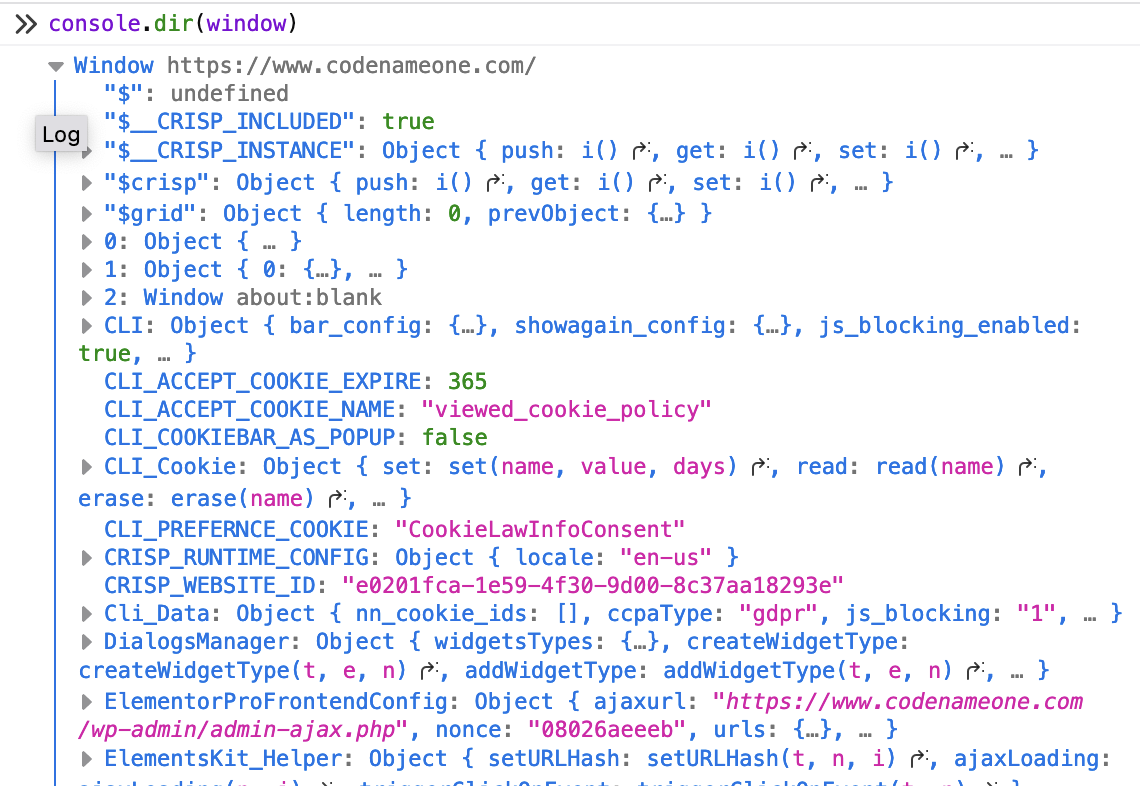
The console.dir() method provides a more detailed view of objects, showing their properties as you’d see in a debugger. This is particularly helpful for inspecting DOM elements or exploring API responses. Meanwhile, console.dirxml() allows you to view objects as XML, which can be useful when debugging HTML structures.
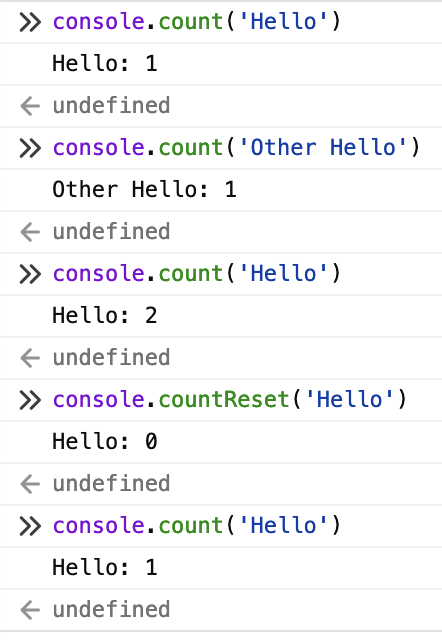
Counting Function Calls
Keeping track of how often a function is called or a code block is executed can be crucial. The console.count() method tracks the number of times it’s invoked, helping you verify that functions are called as expected:
function myFunction() {
    console.count('myFunction called');
}
You can reset the counter using console.countReset(). This simple tool can help you catch performance issues or confirm the correct execution flow.
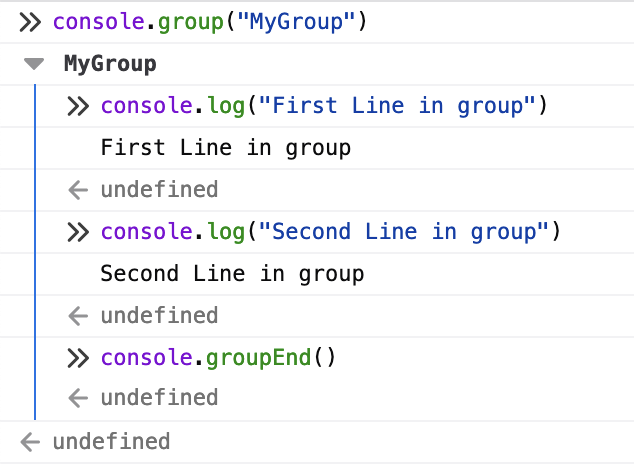
Organizing Logs With Groups
To prevent log clutter, use console groups to organize related messages. console.group() starts a collapsible log section and console.groupEnd() closes it:
console.group('My Group');
console.log('Message 1');
console.log('Message 2');
console.groupEnd();
Grouping makes it easier to navigate complex logs and keeps your console clean.
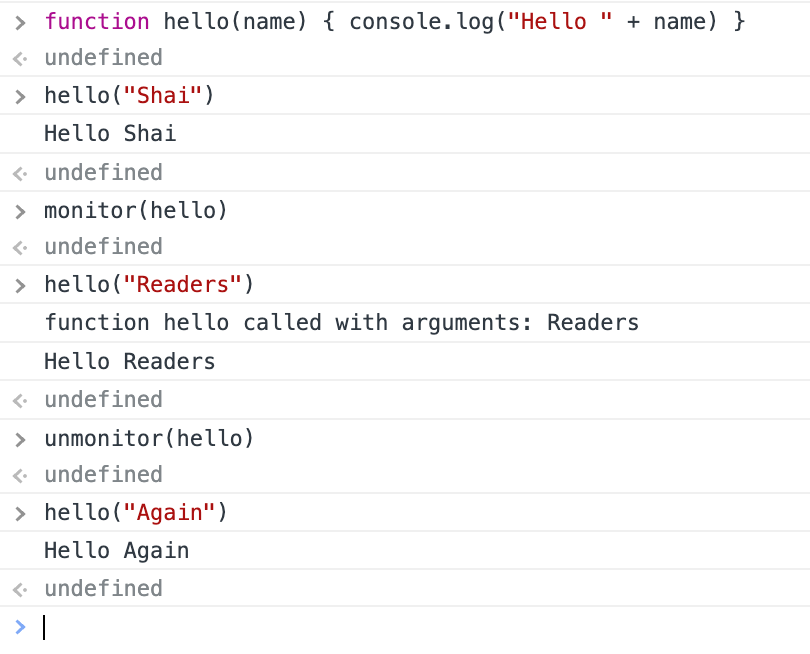
Chrome-Specific Debugging Features
Monitoring Functions: Chrome’s monitor() method logs every call to a function, showing the arguments and enabling a method-tracing experience.
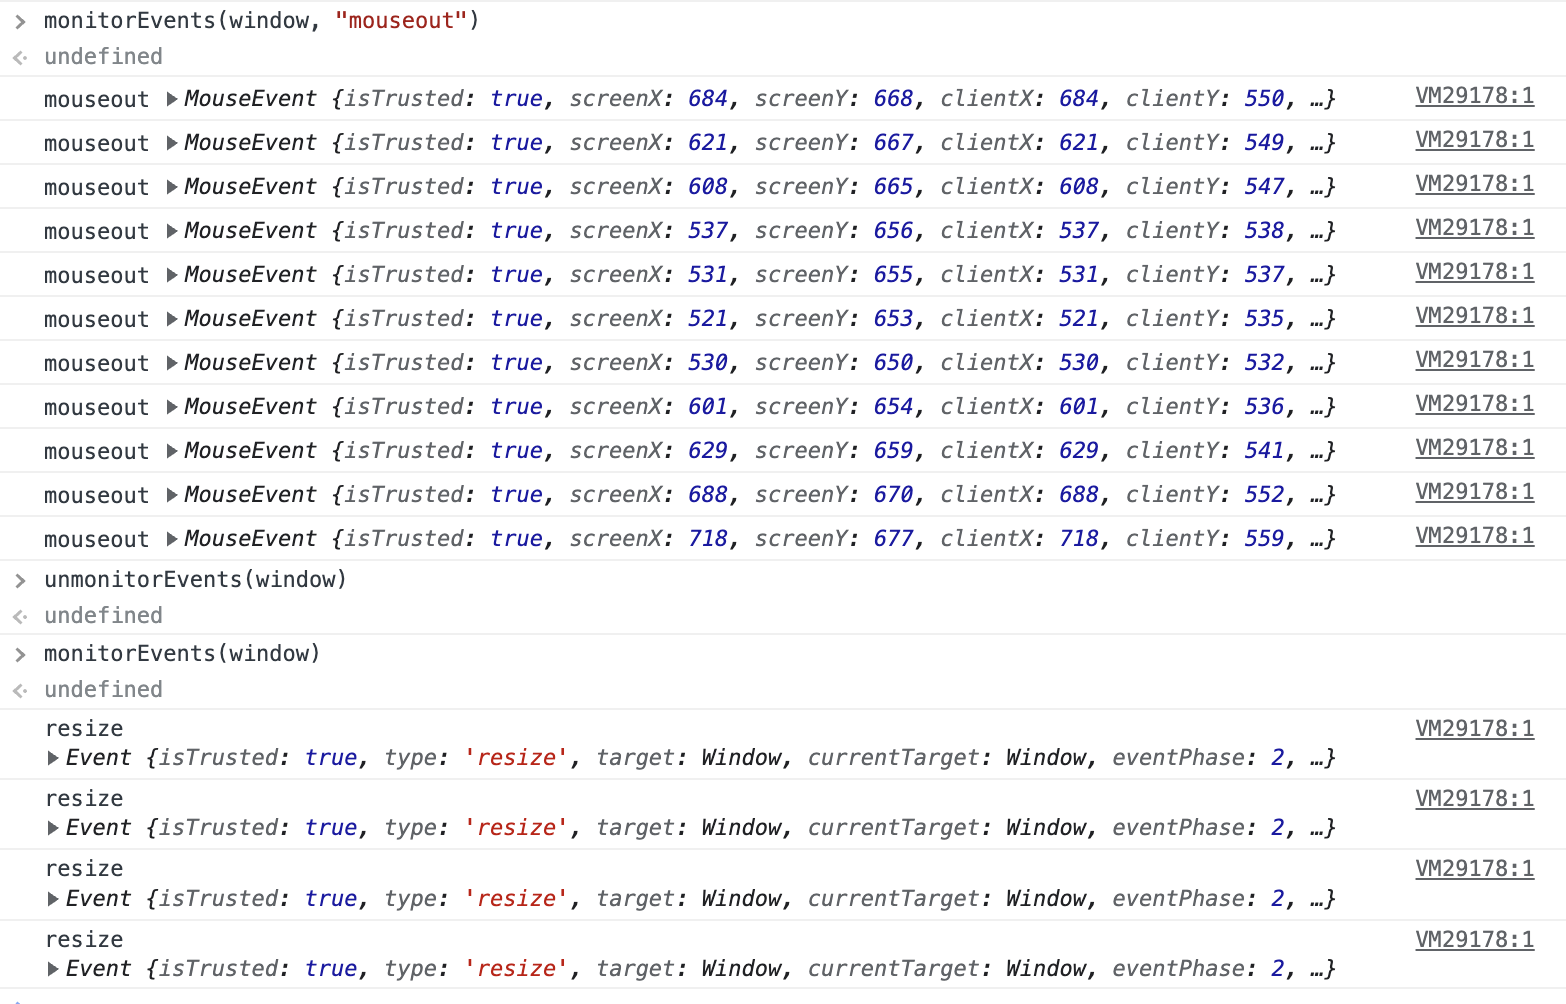
Monitoring Events: Using monitorEvents(), you can log events on an element. This is useful for debugging UI interactions. For example, monitorEvents(window, 'mouseout') logs only mouseout events.
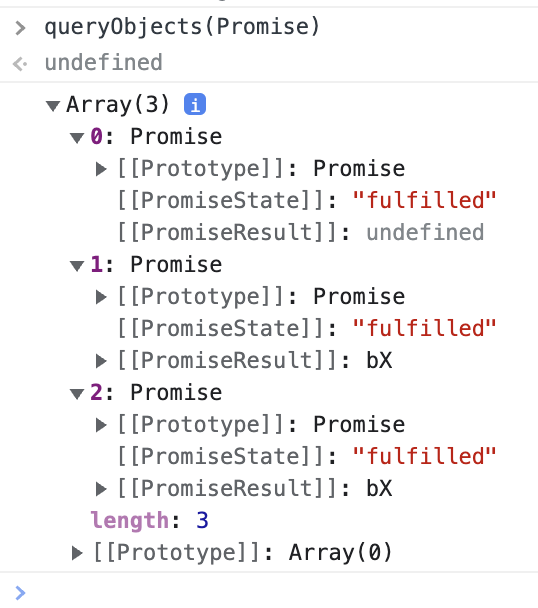
Querying Object Instances: queryObjects(Constructor) lists all objects created with a specific constructor, giving you insights into memory usage and object instantiation.
Final Word
Front-end debugging tools have come a long way. These tools provide a rich set of features that go far beyond simple console.log() statements. From log levels and CSS styling to assertions and event monitoring, mastering these techniques can transform your debugging workflow.
If you read this post as part of my series, you will notice a big change in my attitude toward debugging when we reach the front end. Front-end debugging is very different from back-end debugging. When debugging the backend, I’m vehemently against code changes for debugging (e.g., print debugging), but on the frontend, this can be a reasonable hack. The change in environment justifies it. The short lifecycle, the single-user use case, and the risk are smaller.
Video
Published at DZone with permission of Shai Almog. See the original article here.
Opinions expressed by DZone contributors are their own.
Comments