How To Use Smart-Doc To Generate JMeter Scripts
Explore smart-doc, used to automatically scan code to generate JMeter performance test scripts, improving the efficiency of performance stress testing.
Join the DZone community and get the full member experience.
Join For Freesmart-doc is a tool for automatically generating Java API documentation. It creates documentation by analyzing interfaces and comments in the source code and supports a variety of document output formats, including Markdown, HTML5, OpenAPI 3.0, and more. The design goal of smart-doc is to simplify the document writing process, improve development efficiency, and ensure the accuracy and timeliness of the documentation.
In the software development lifecycle, the automatic generation of API documentation and the performance testing of interfaces are key steps in improving development efficiency and ensuring product quality. With the addition of the ability to generate JMeter performance testing scripts in smart-doc version 3.0.1, developers can more conveniently accomplish these two tasks. This article will introduce how to use smart-doc and JMeter for effective performance testing.

Generate JMeter Scripts
Using smart-doc to generate JMeter performance test scripts can significantly reduce the time taken to write performance test scripts, thereby improving testing efficiency. The JMeter scripts that are automatically generated by smart-doc can be directly run in JMeter without the need for complex configuration and debugging, making performance testing much simpler and faster.
First, ensure that the smart-doc-maven-plugin has been added to your project. Then, configure the relevant parameters of the smart-doc plugin in the pom.xml file of the project, for example:
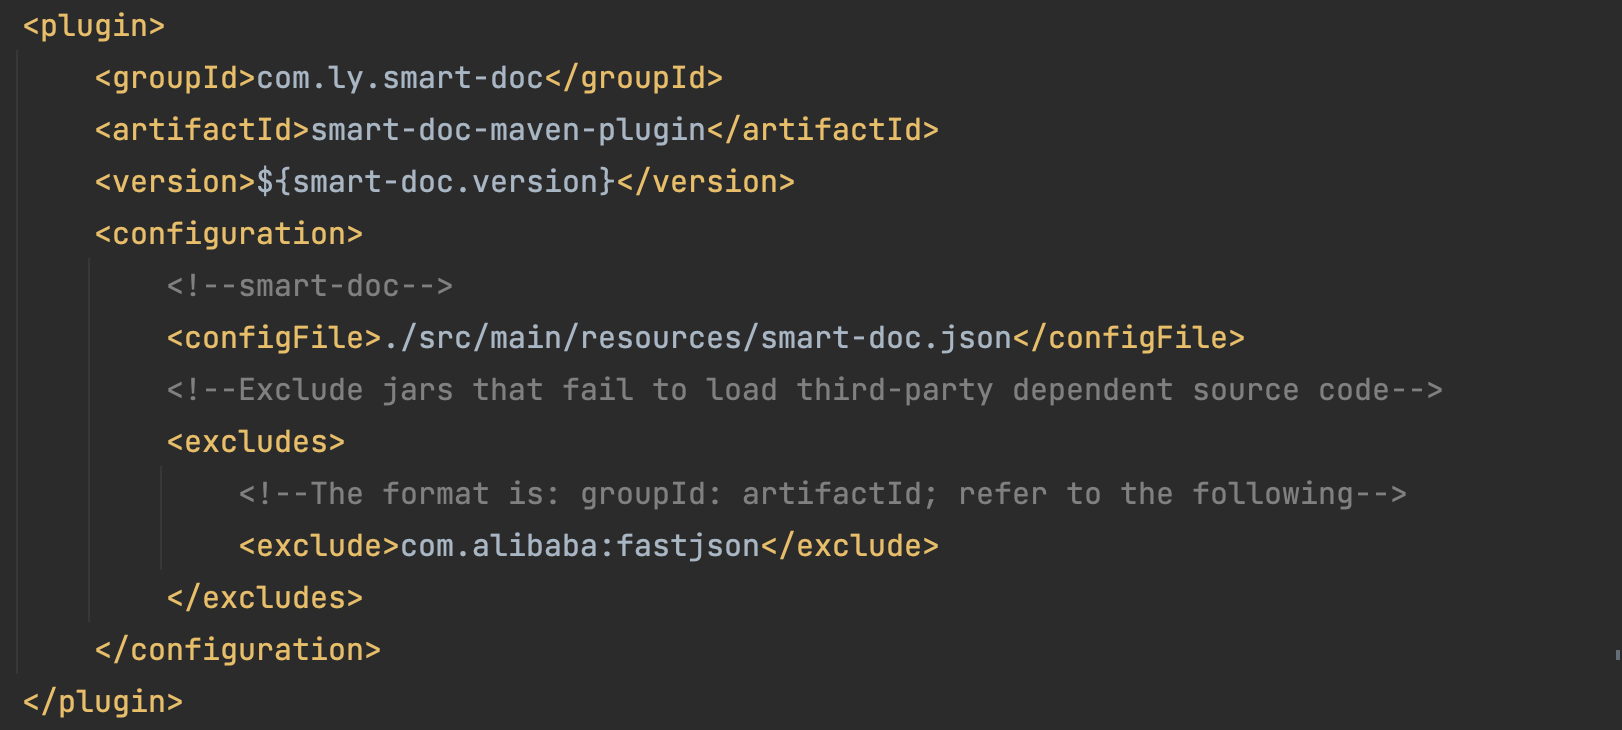
Run the command mvn -Dfile.encoding=UTF-8 smart-doc:jmeter. Smart-doc will scan the project source code, extract annotation information, and automatically generate the corresponding JMeter performance test scripts.
Those who are not familiar with how to use it can refer to the official smart-doc documentation.
Import Into JMeter
Open JMeter, click "File" -> "Open", select the JMeter script file generated in the first step, and click the "Start" button. JMeter will then begin performing performance tests according to the script.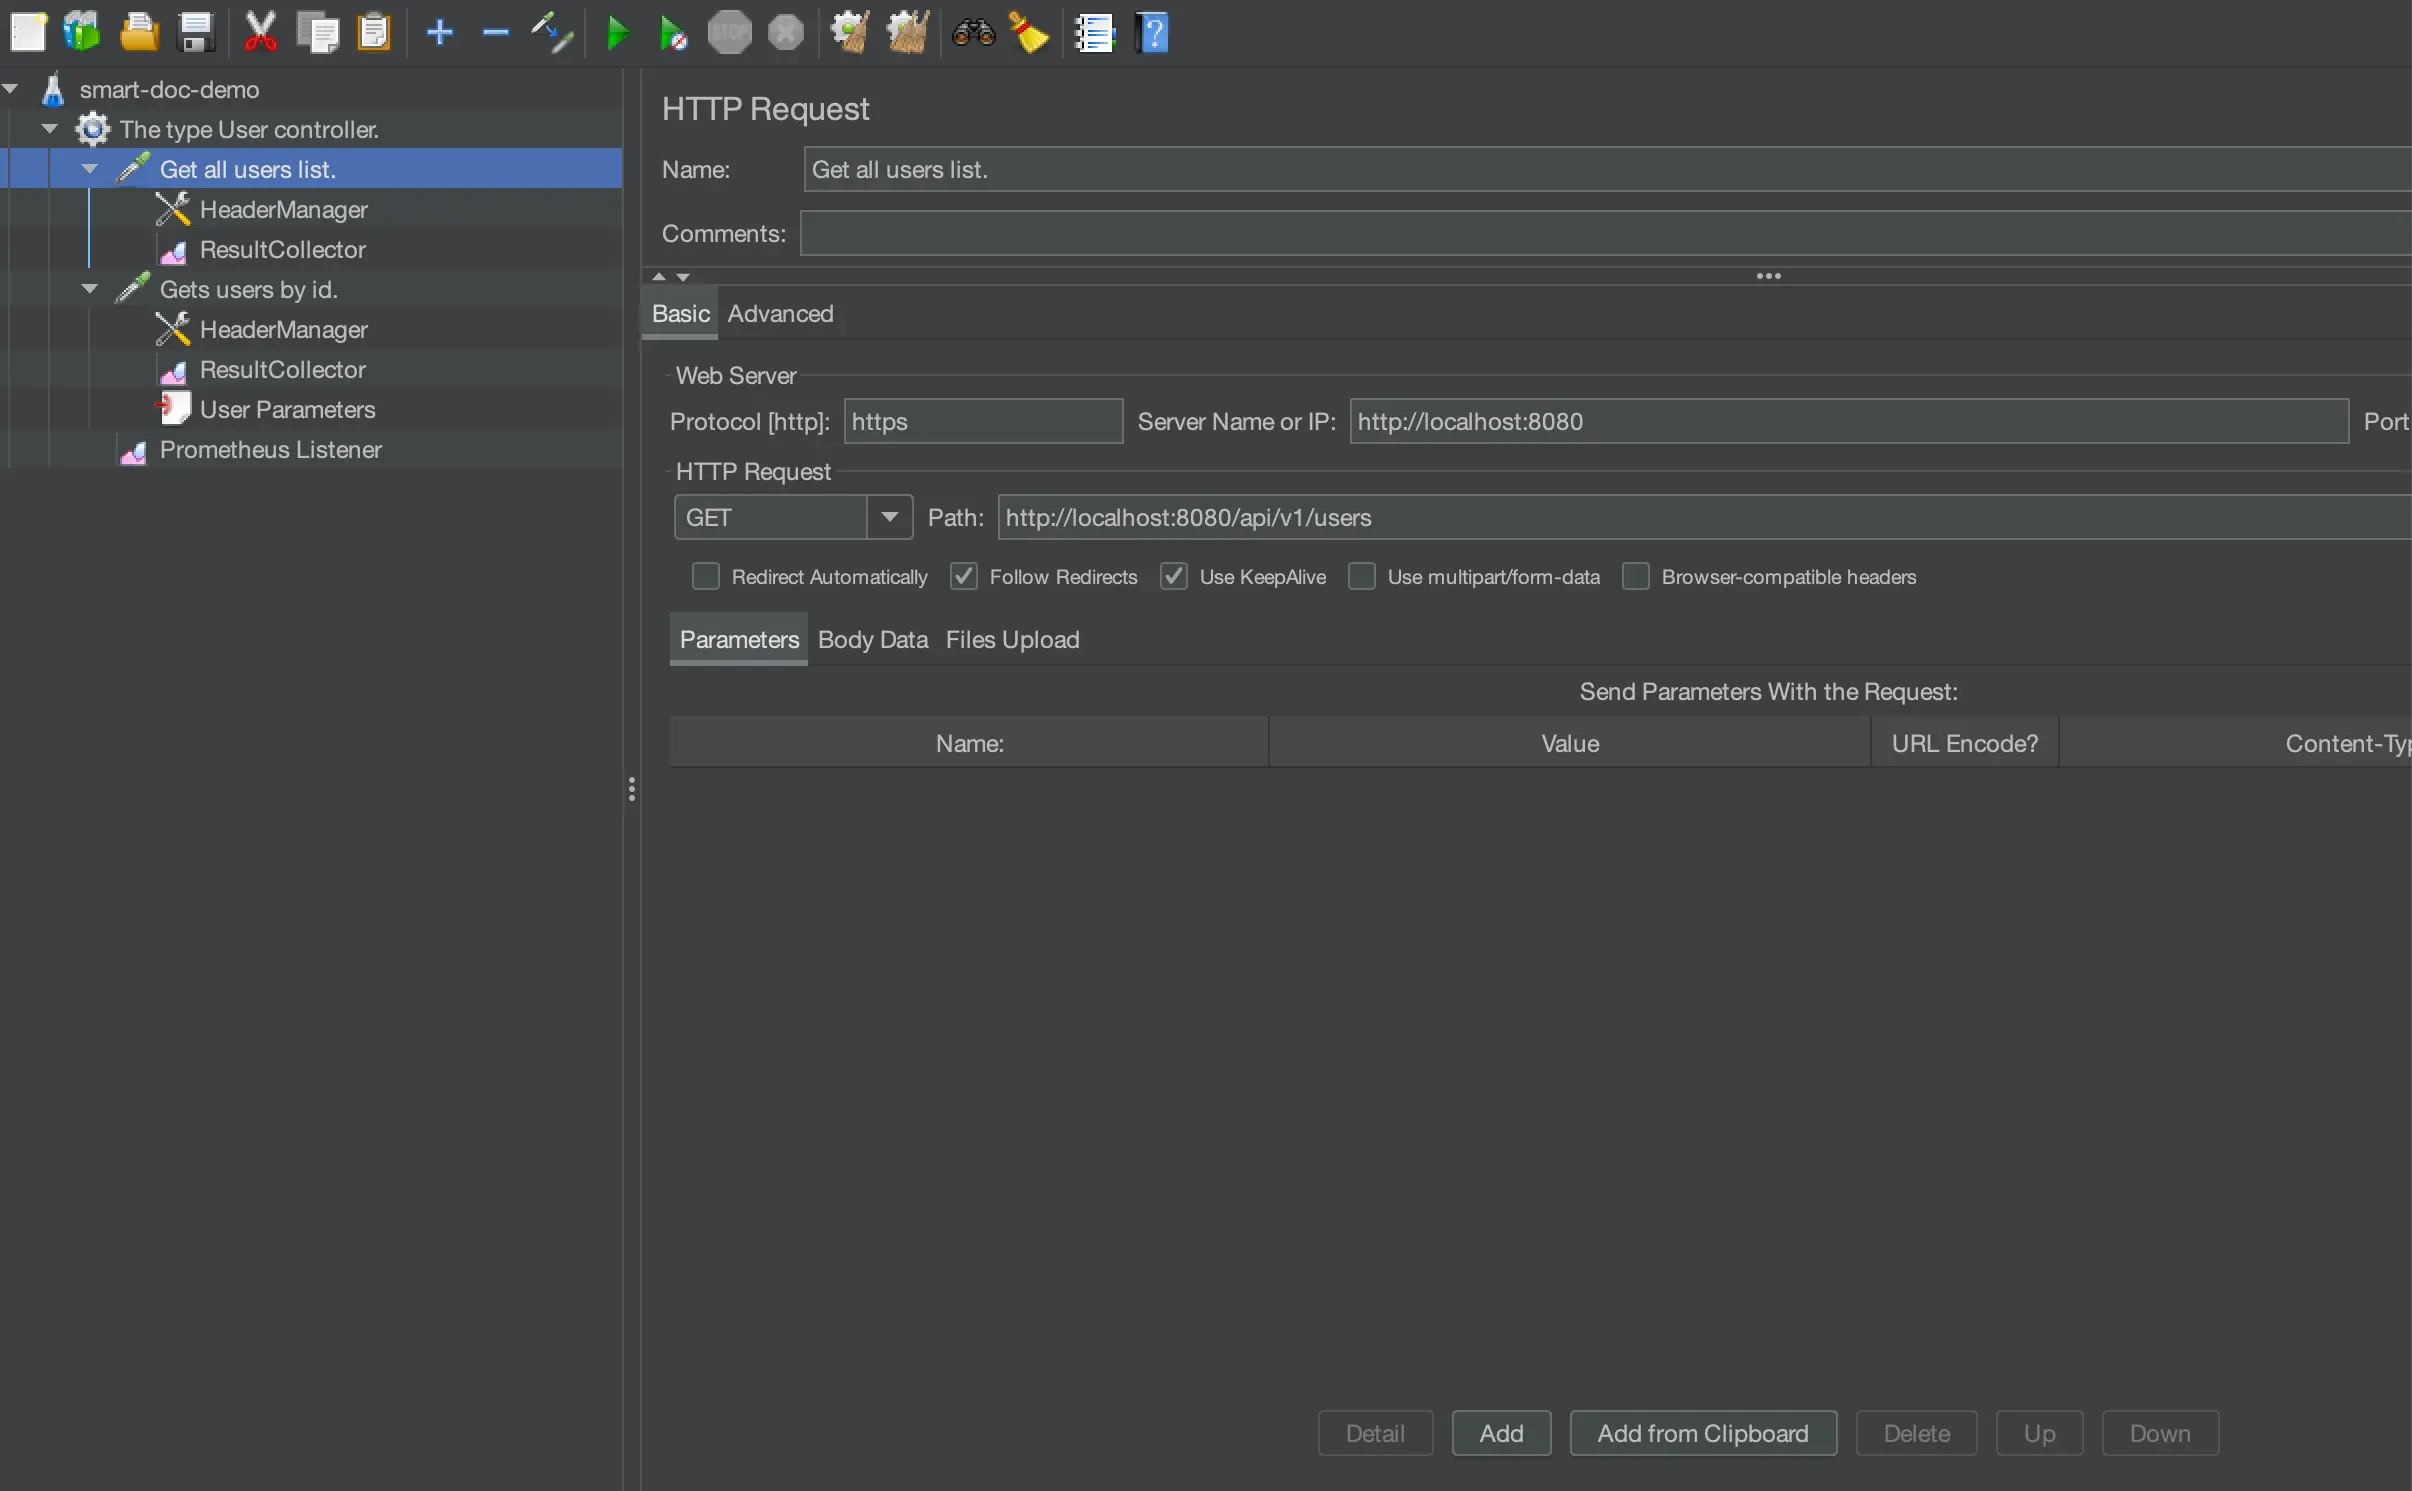
Configure Prometheus
Prometheus is an open-source monitoring and alerting tool for handling time-series data. We can use it to perform real-time monitoring during the JMeter stress testing process, thereby enhancing the observability of performance testing.
Step 1: Install the JMeter Prometheus Plugin
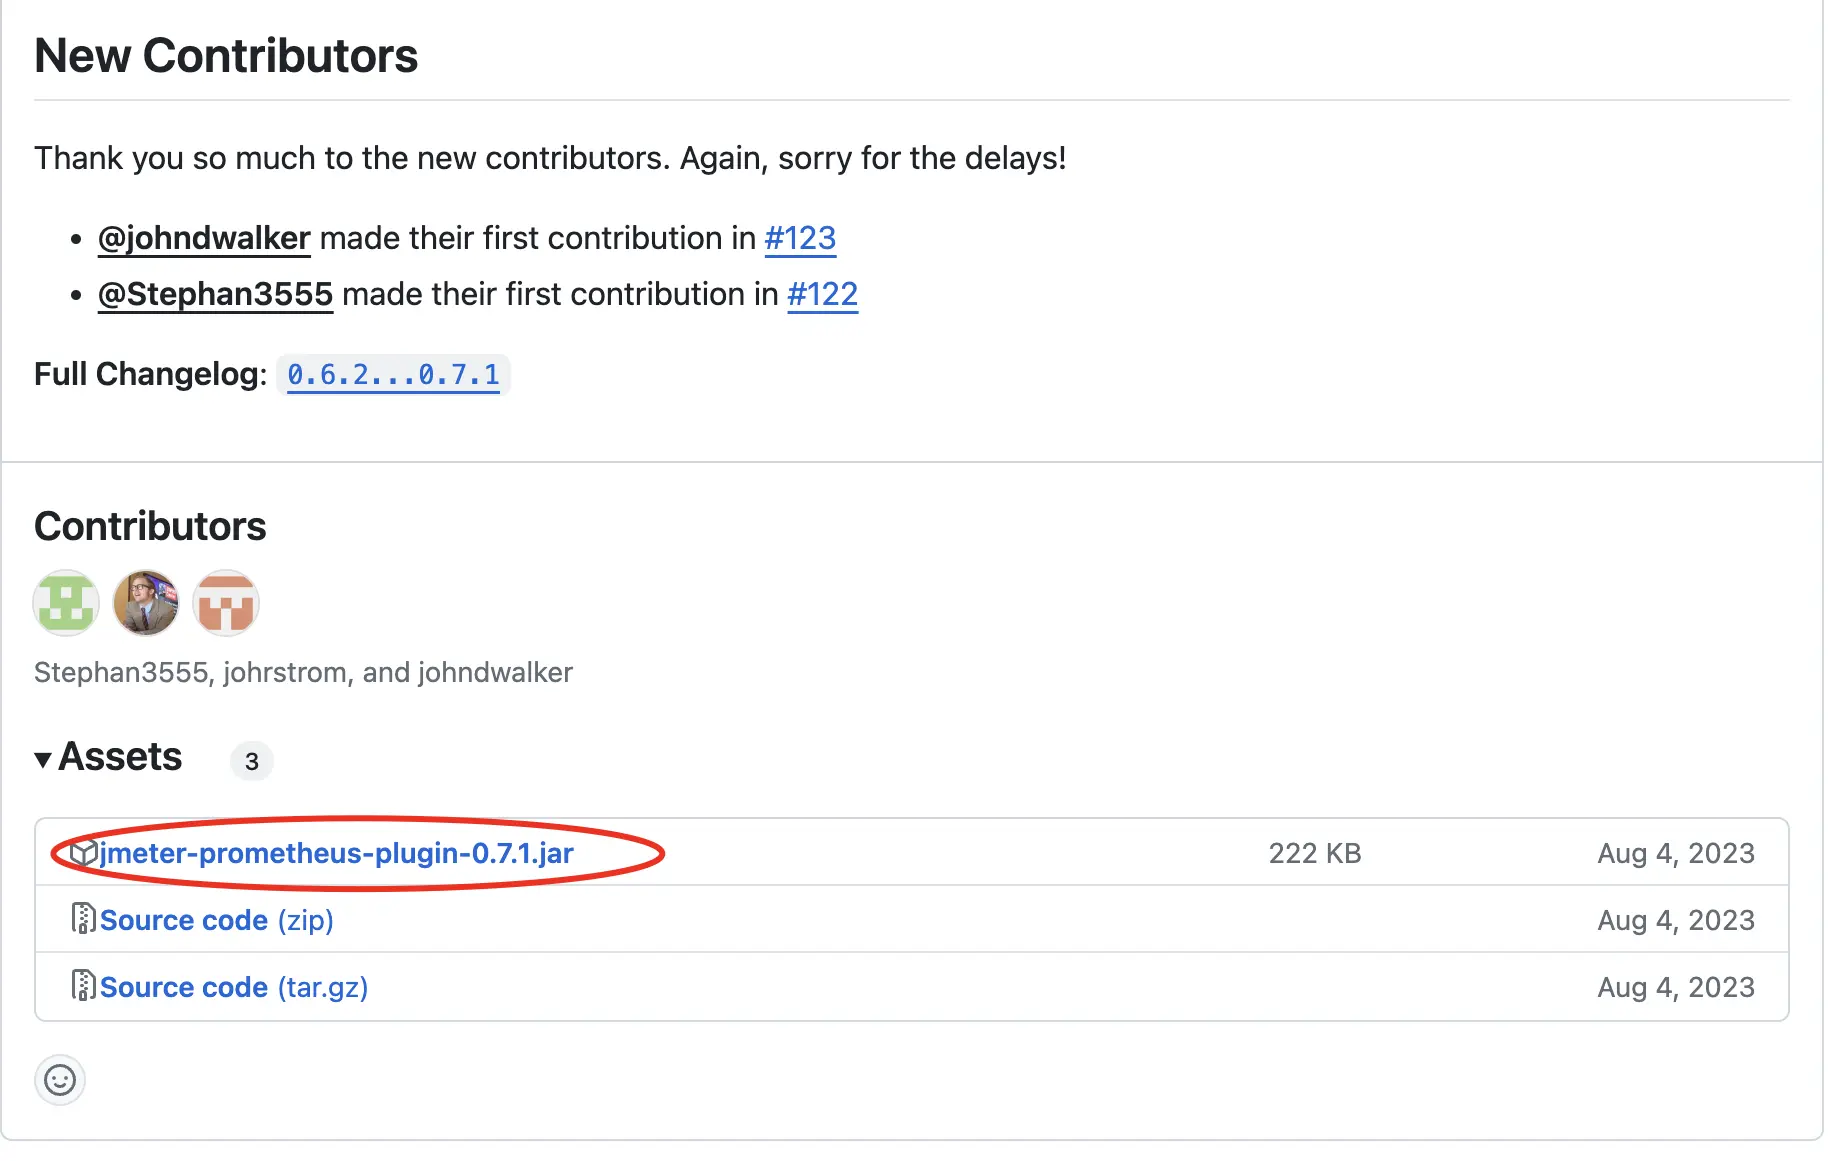
First, you need to install the Prometheus plugin in the lib/ext directory of JMeter. You can download the plugin from the JMeter Plugins Manager or the official website. It can also be downloaded from GitHub. For this instance, download the latest version 0.7.1 from GitHub.
- Note: JMeter's default listening IP address is
127.0.0.1, which by default will prevent Prometheus from connecting to the JMeter Prometheus listening port. Therefore, it is necessary to addprometheus.ip=0.0.0.0injmeter.properties.
Step 2: Add Prometheus Listener
Open JMeter and add the Prometheus Listener to your test plan. This can be done by right-clicking on Test Plan-> Add -> Listener -> Prometheus Listener.
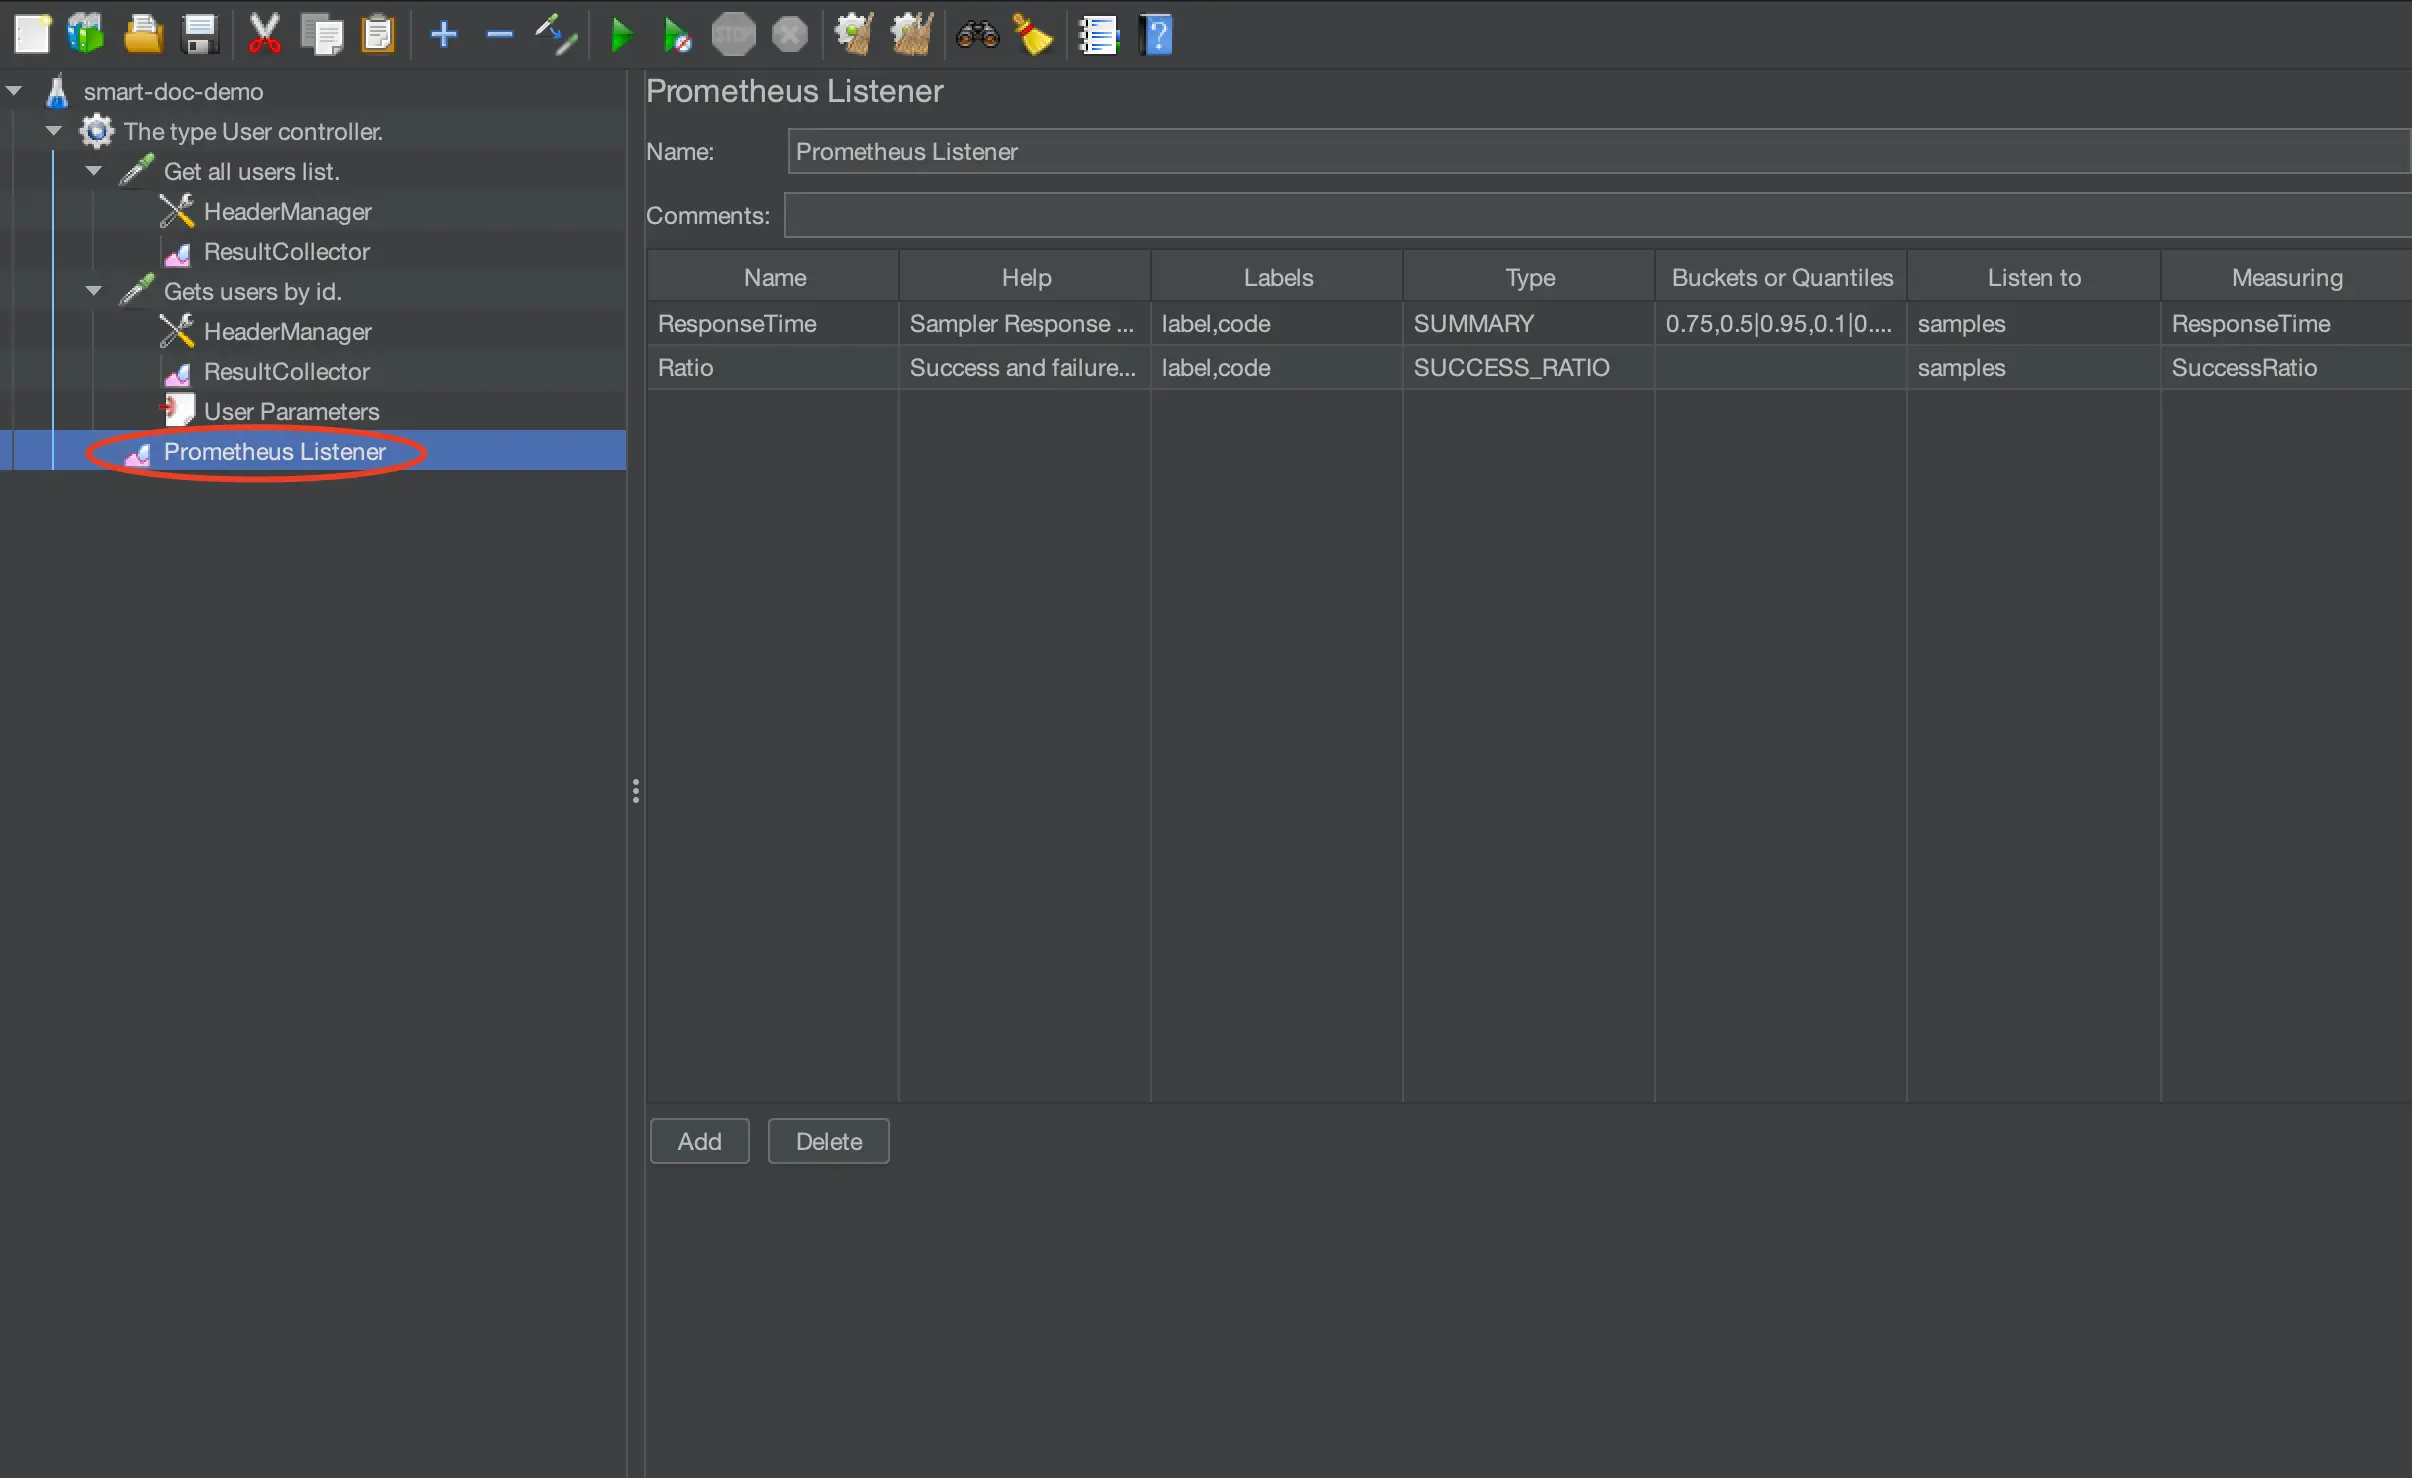
The configuration of the listener can refer to the official settings, with reference as follows (smart-doc 3.0.4 supports configuring and adding Prometheus Listener generation):

Step 3: Configure Prometheus Scrape
In the configuration file of Prometheus (prometheus.yml), add a new scrape_config to fetch data from the JMeter Prometheus plugin. For example:
scrape_configs:
  - job_name: 'jmeter'
    scrape_interval: 15s
    static_configs:
        - targets: ['<Your JMeter machine IP>:9270']
Here, <Your JMeter machine IP> is the IP address of the machine running the JMeter test, and 9270 is the default listening port for the JMeter Prometheus plugin.
Step 4: Run the Test Plan
For the purpose of easy verification in this article, the thread group is set to "infinite loop" during stress testing, which can be adjusted according to actual needs.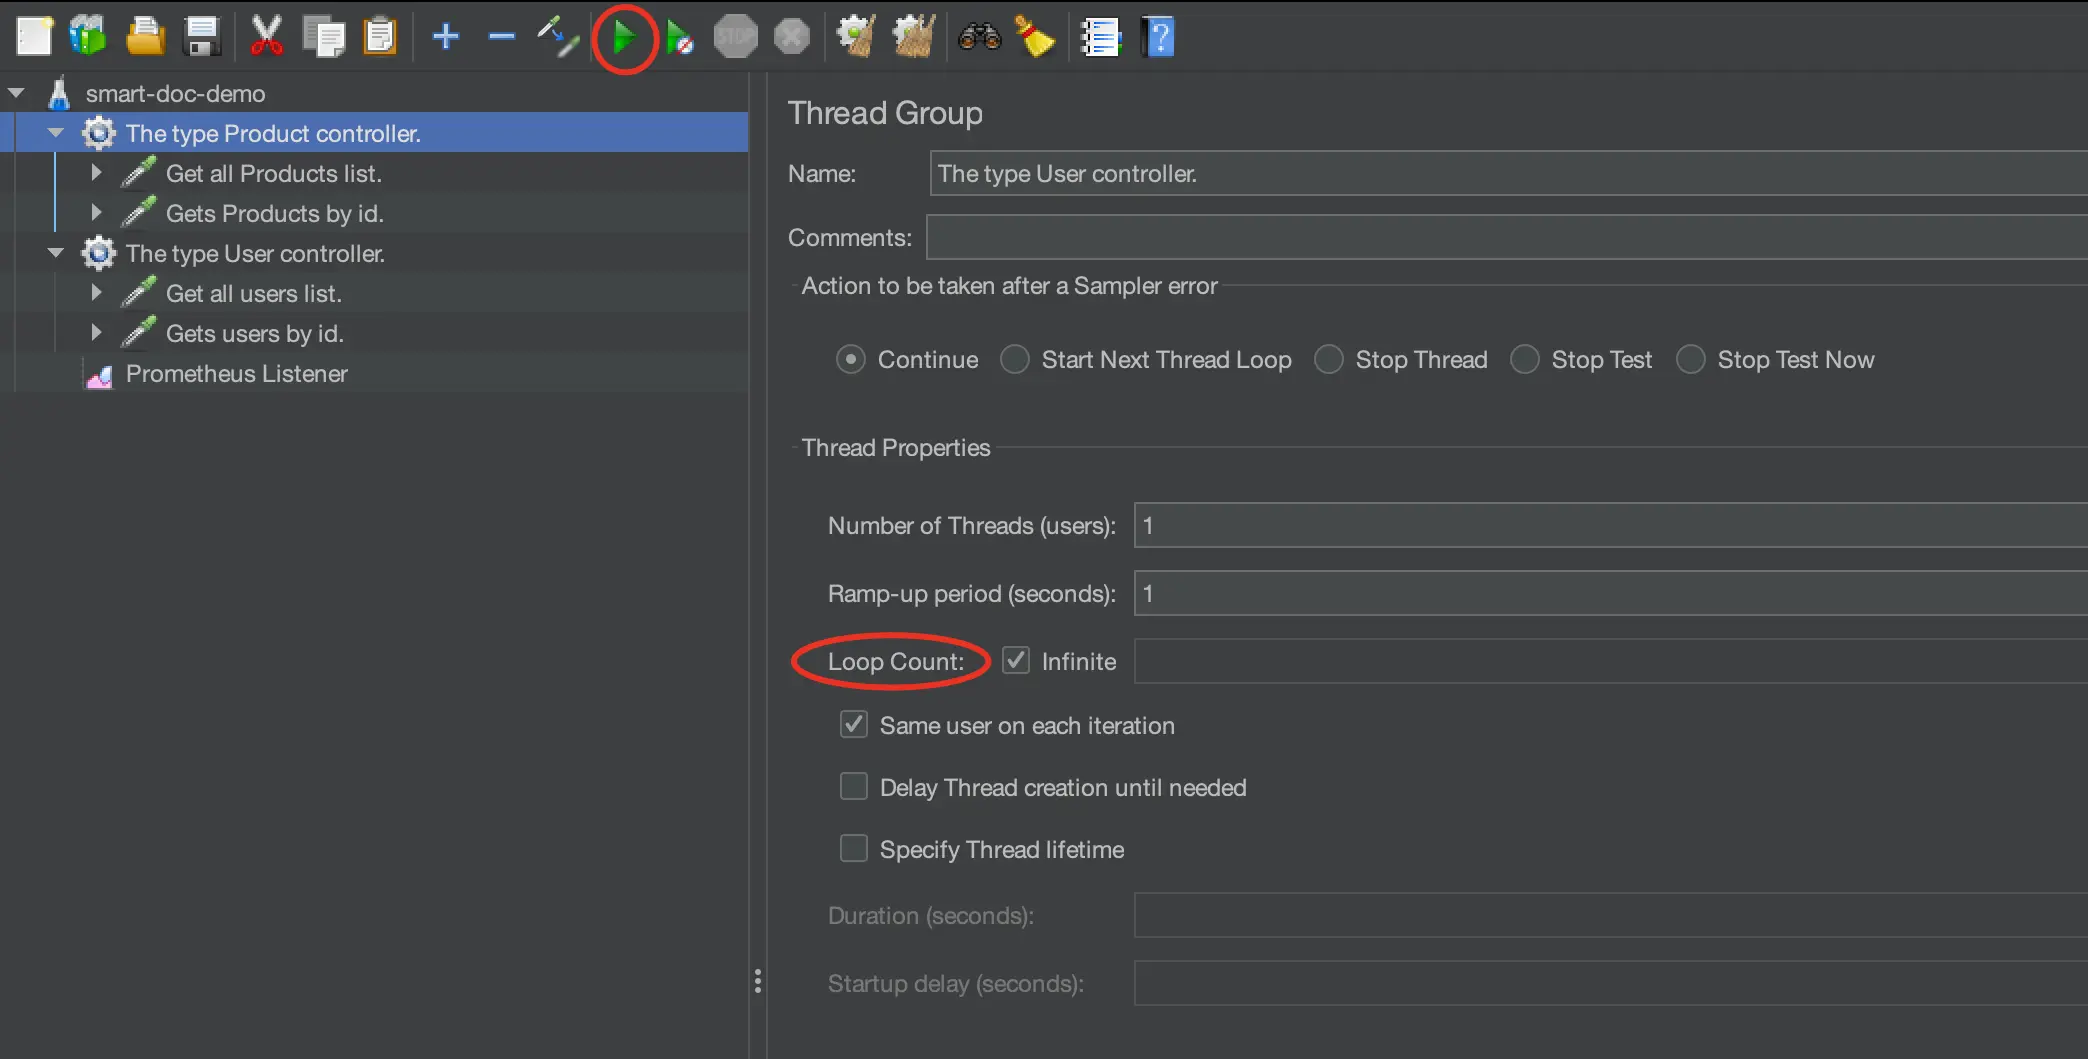
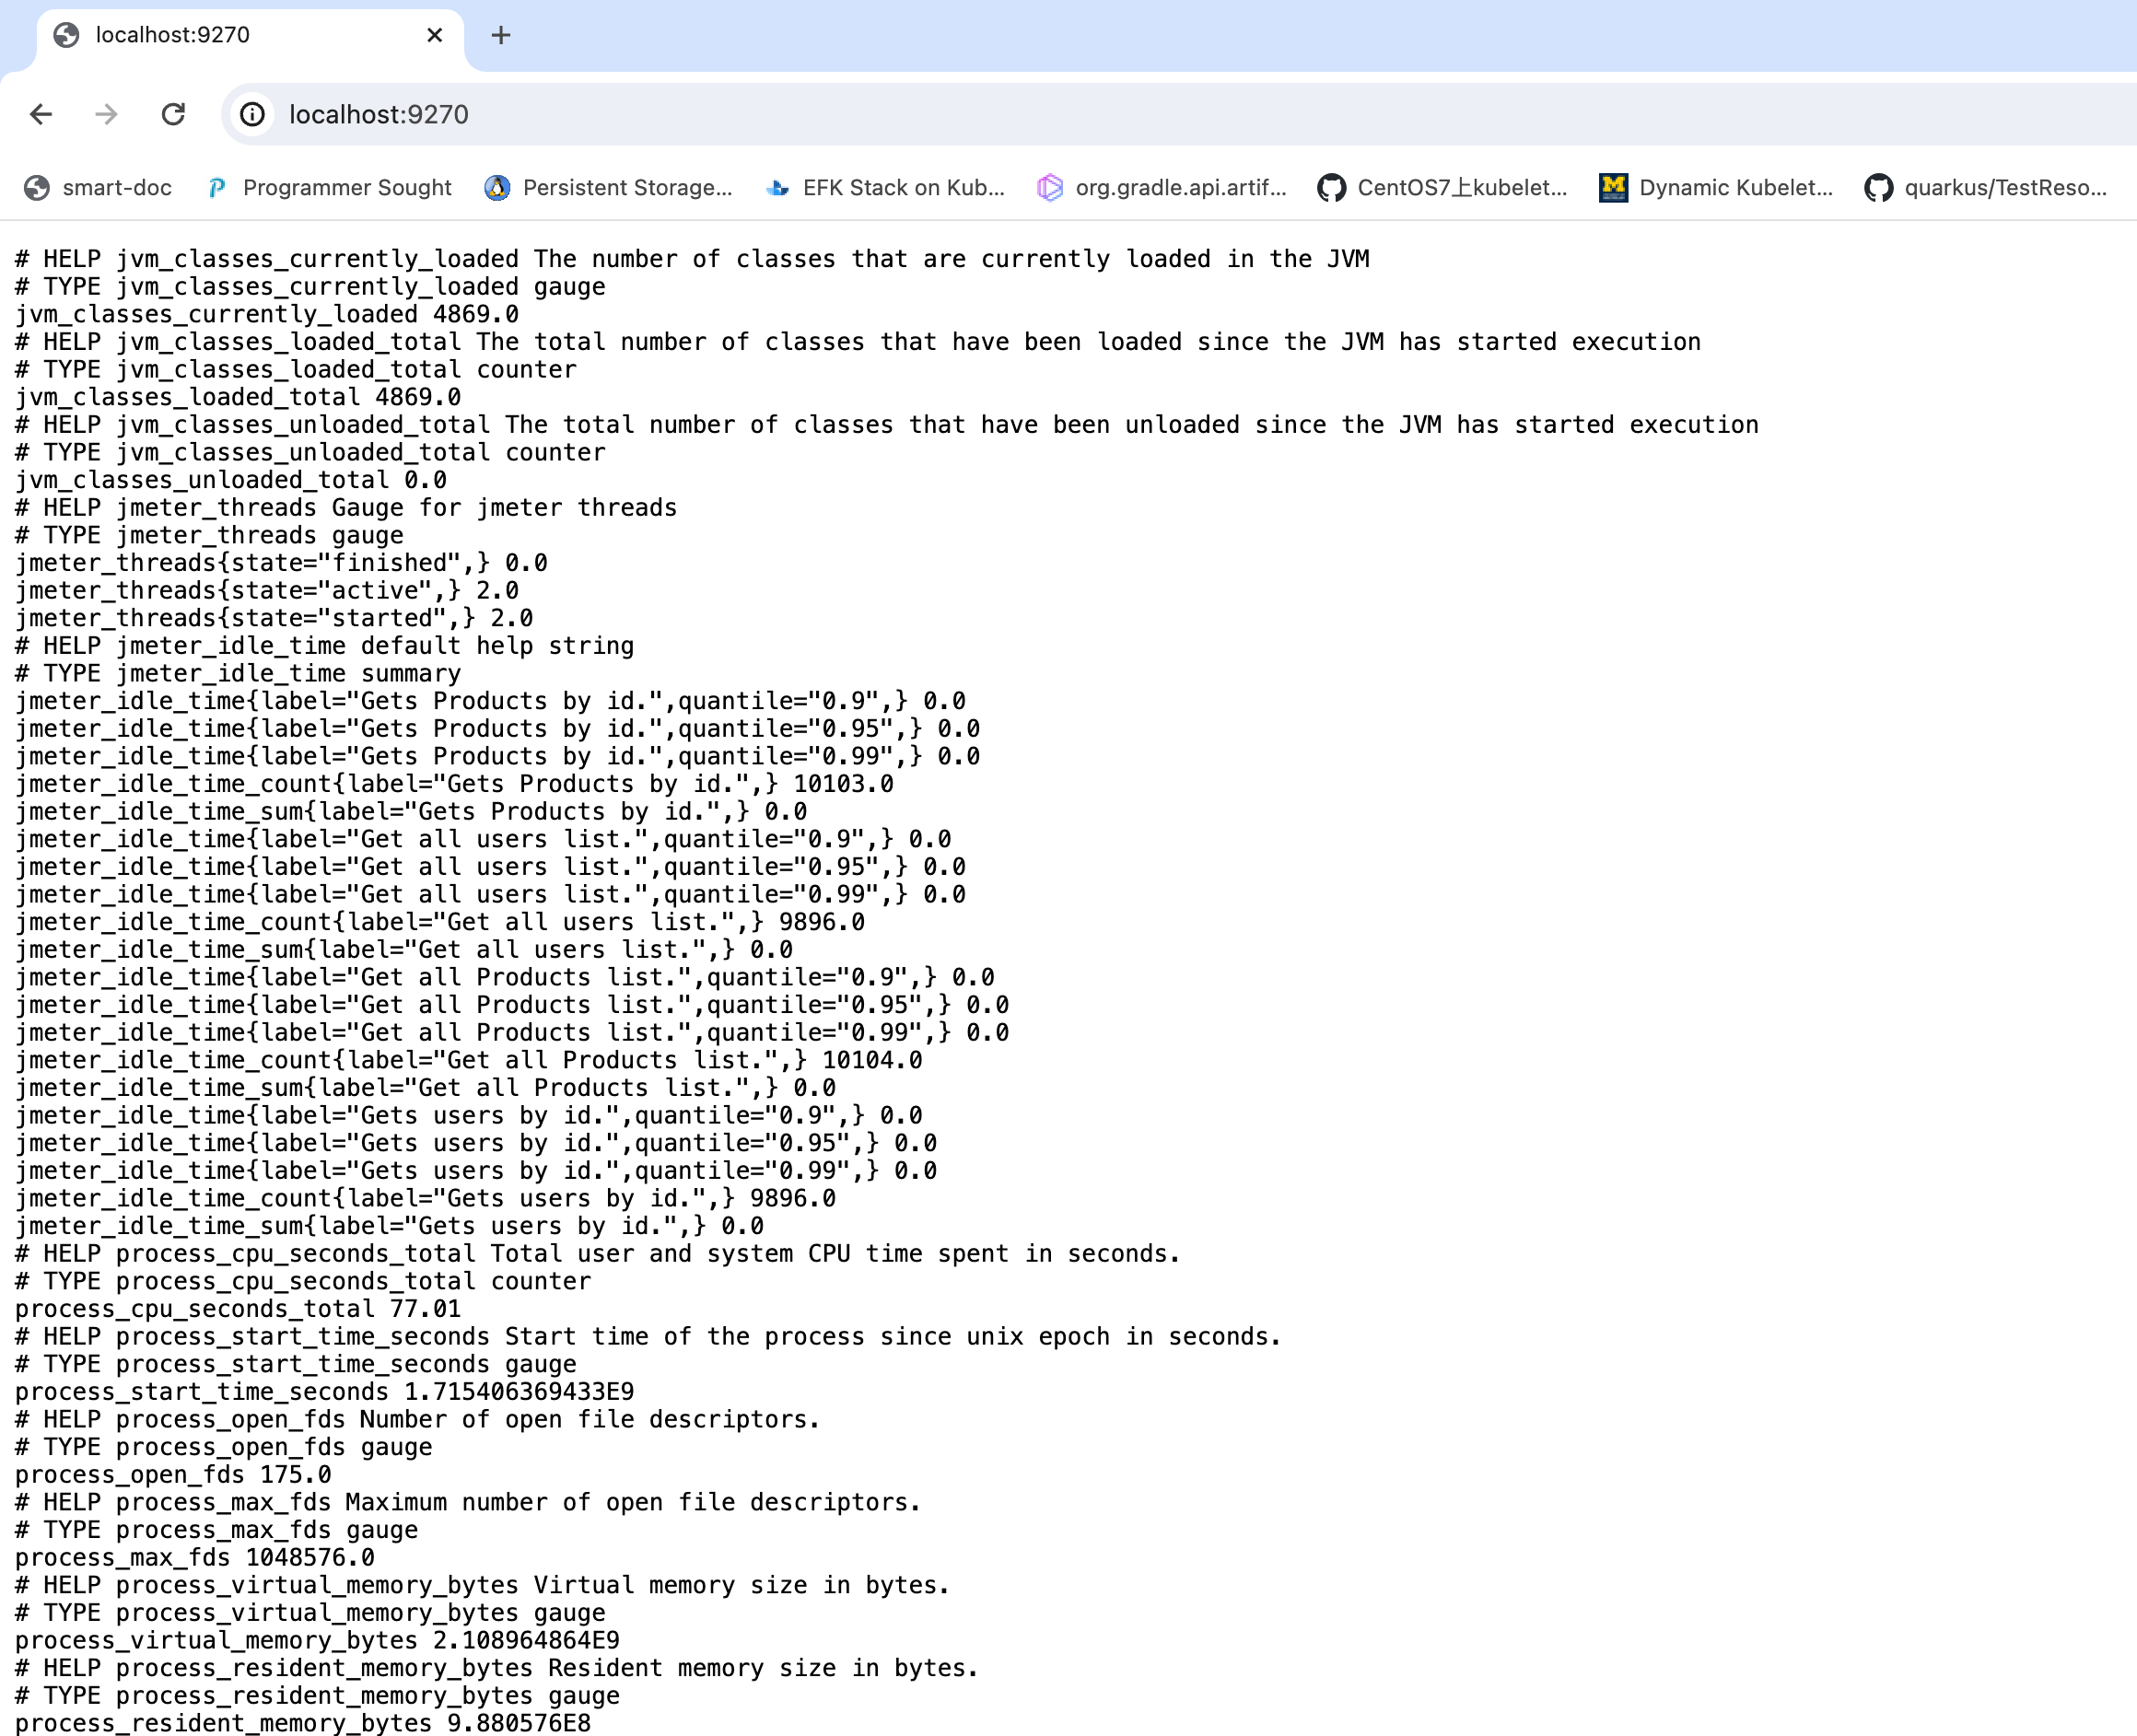
After starting successfully, JMeter Prometheus will, by default, create a service on the local port 9270.
Access the URL http://localhost:9270/metrics and if you see the following content, it means it has been successful.
Step 5: Start Prometheus
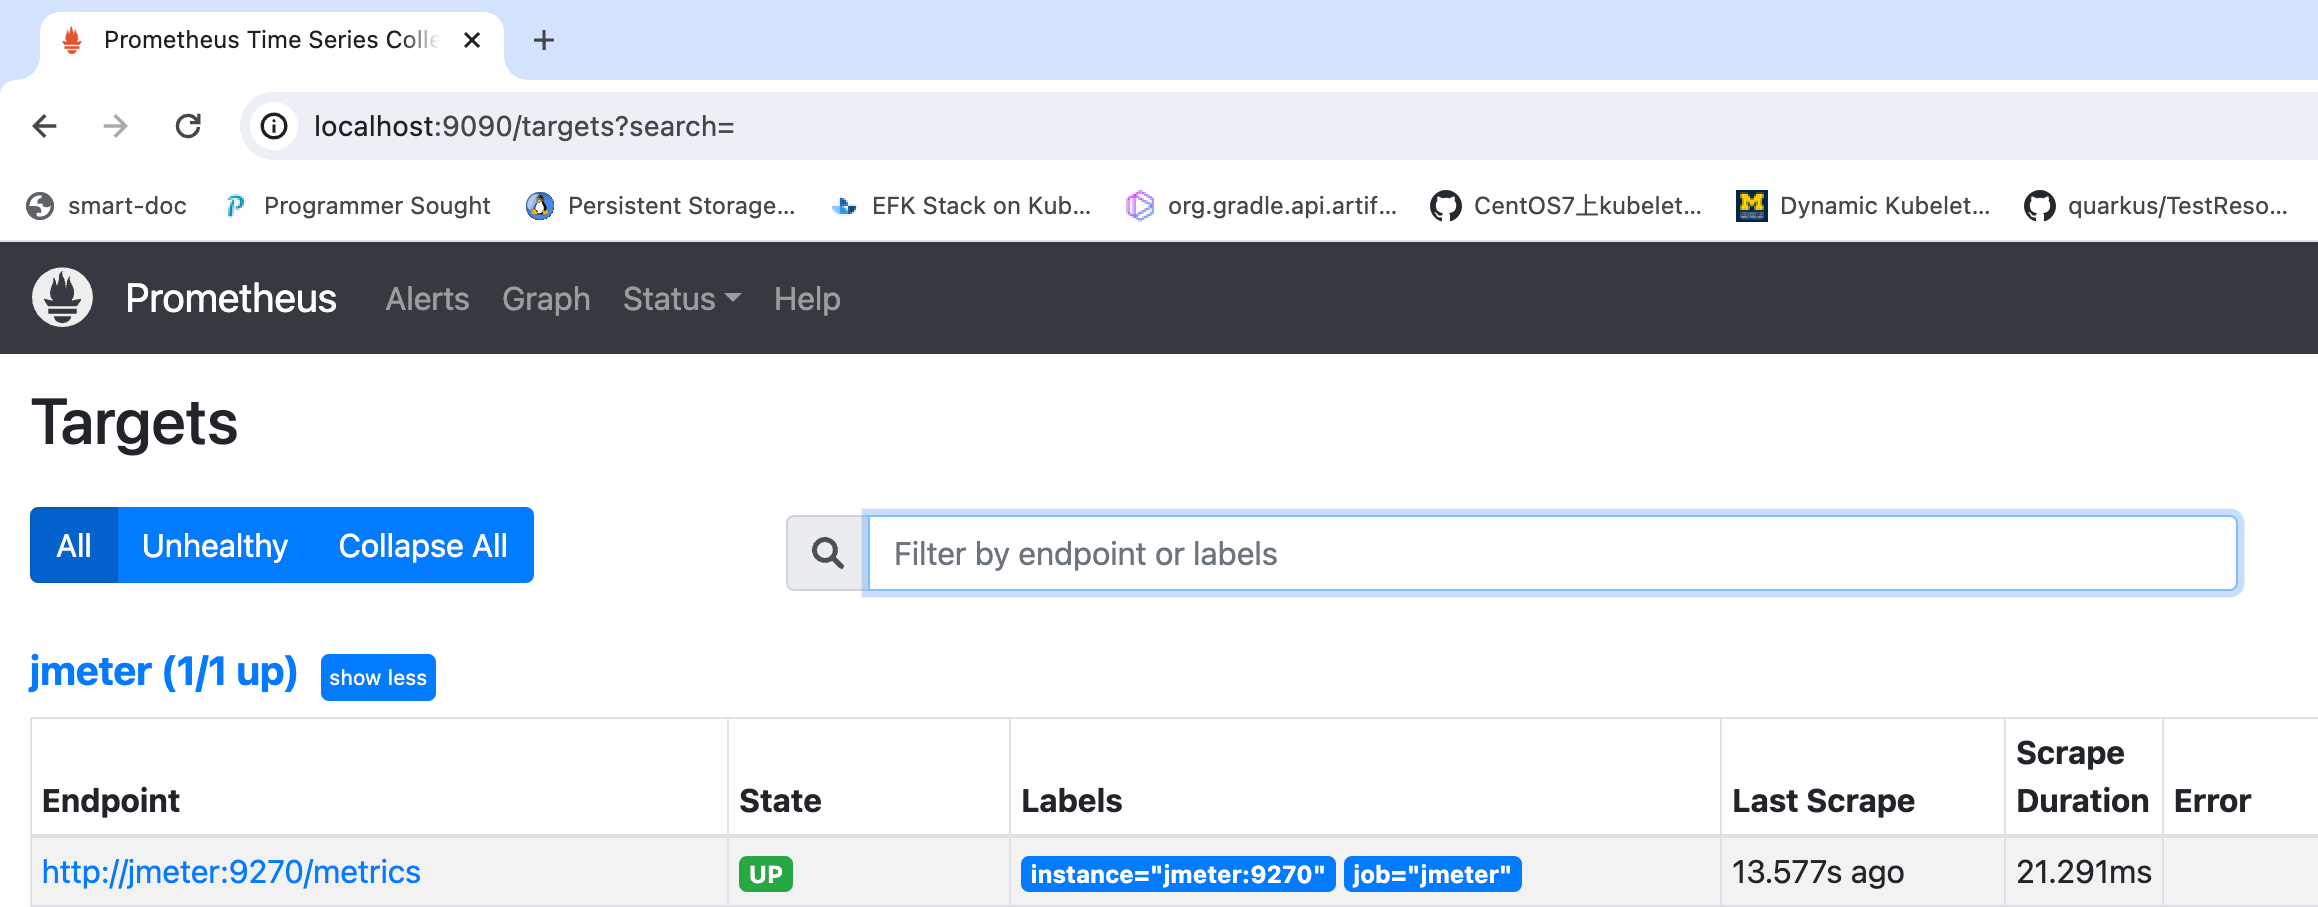
After starting Prometheus, it will begin to fetch data from the JMeter Prometheus plugin. As shown in the following configuration, once successfully started, you can see the set targets in Prometheus.
![Setting the targets in Prometheus]()
Step 6: Configure Grafana
On the Grafana official website, find the prometheus-jmeter monitoring panel provided by the official site. Here, we select the template with ID 14927 to import into Grafana.
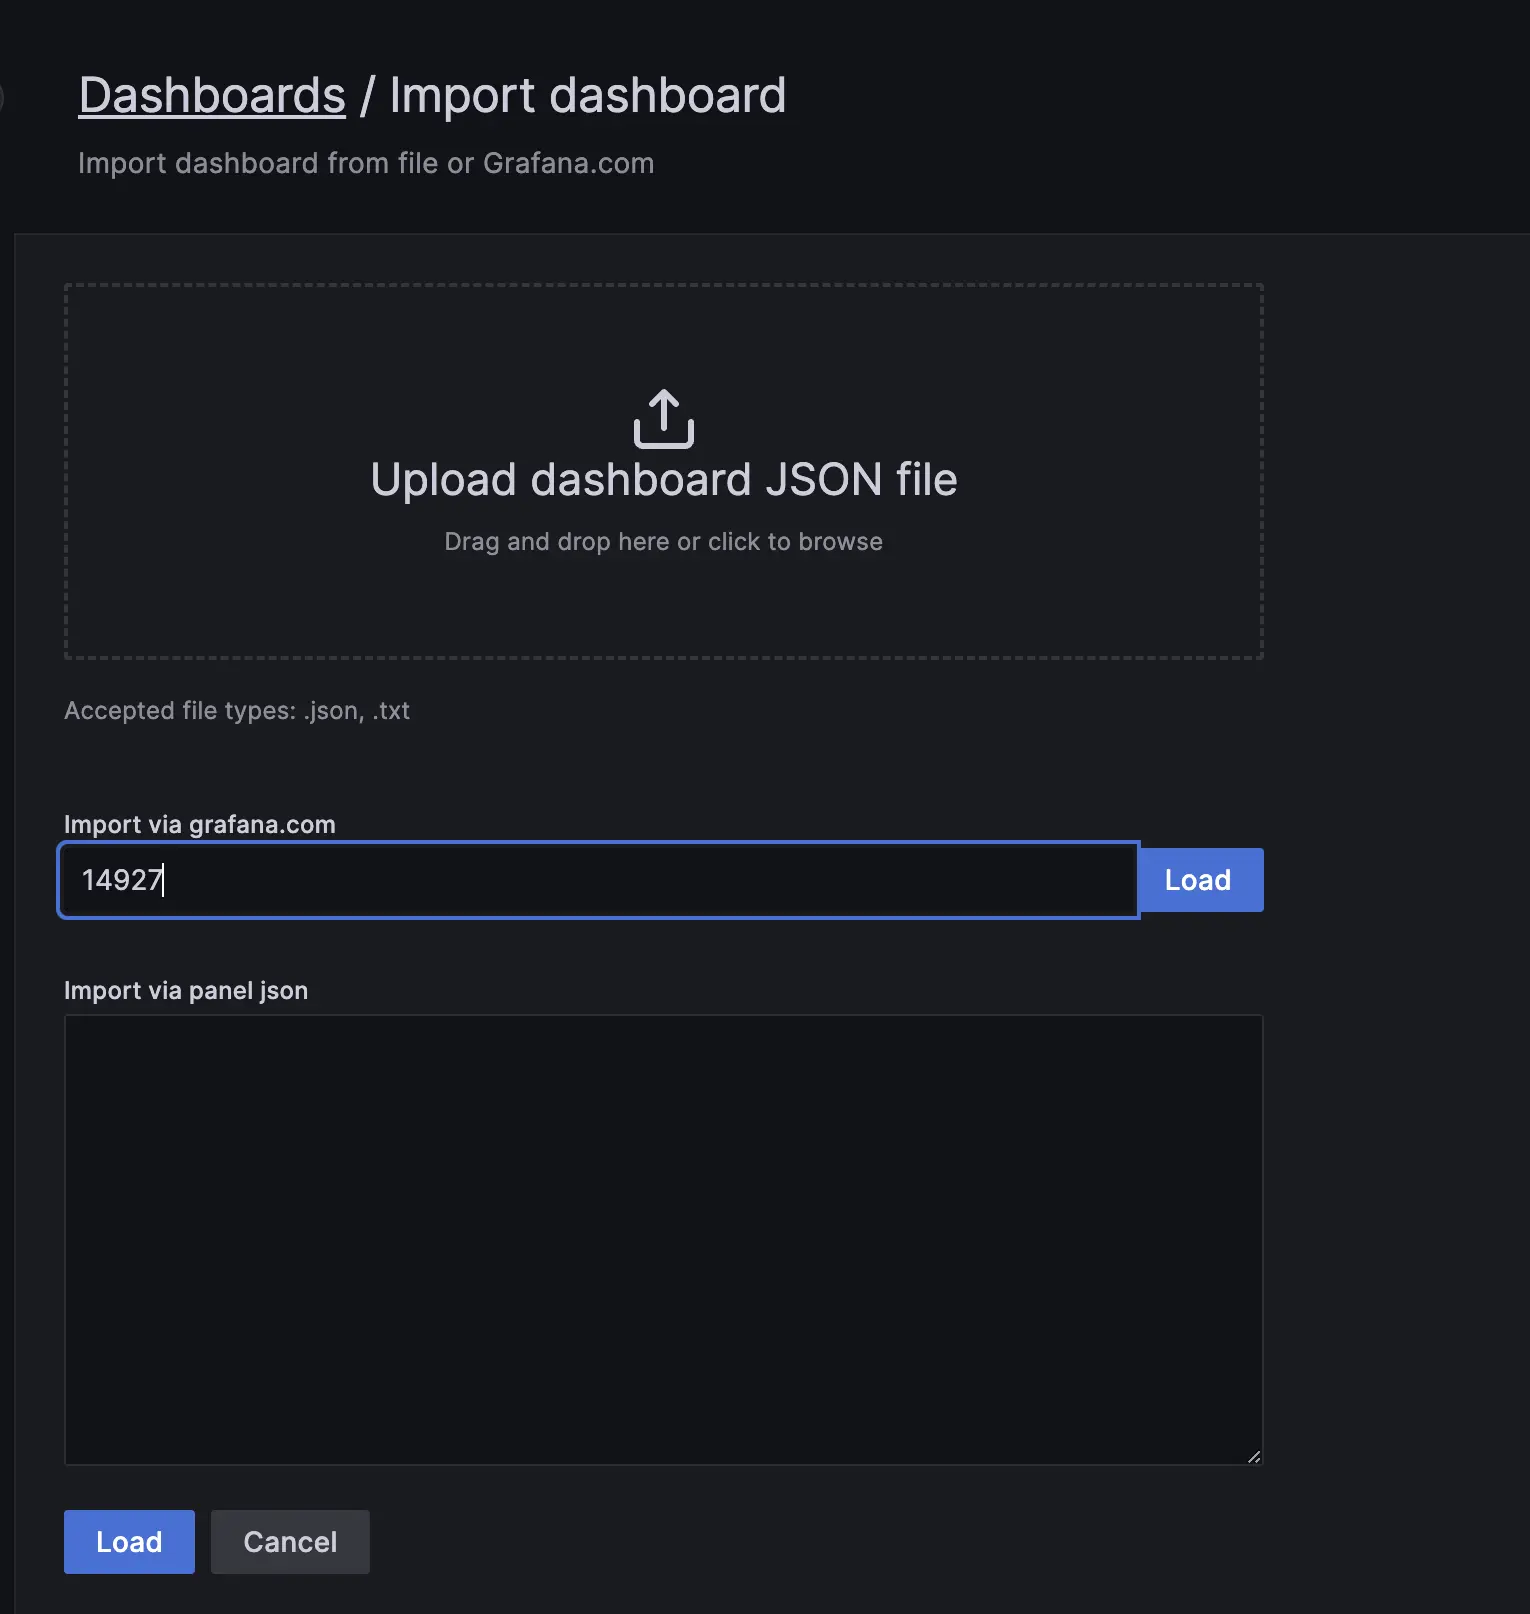
After clicking Load, select the Prometheus data source.
- Note: During testing, it was found that the original template
14927had some errors. These were fixed during the writing process of this article. Import the corrected template downloaded from GitHub.
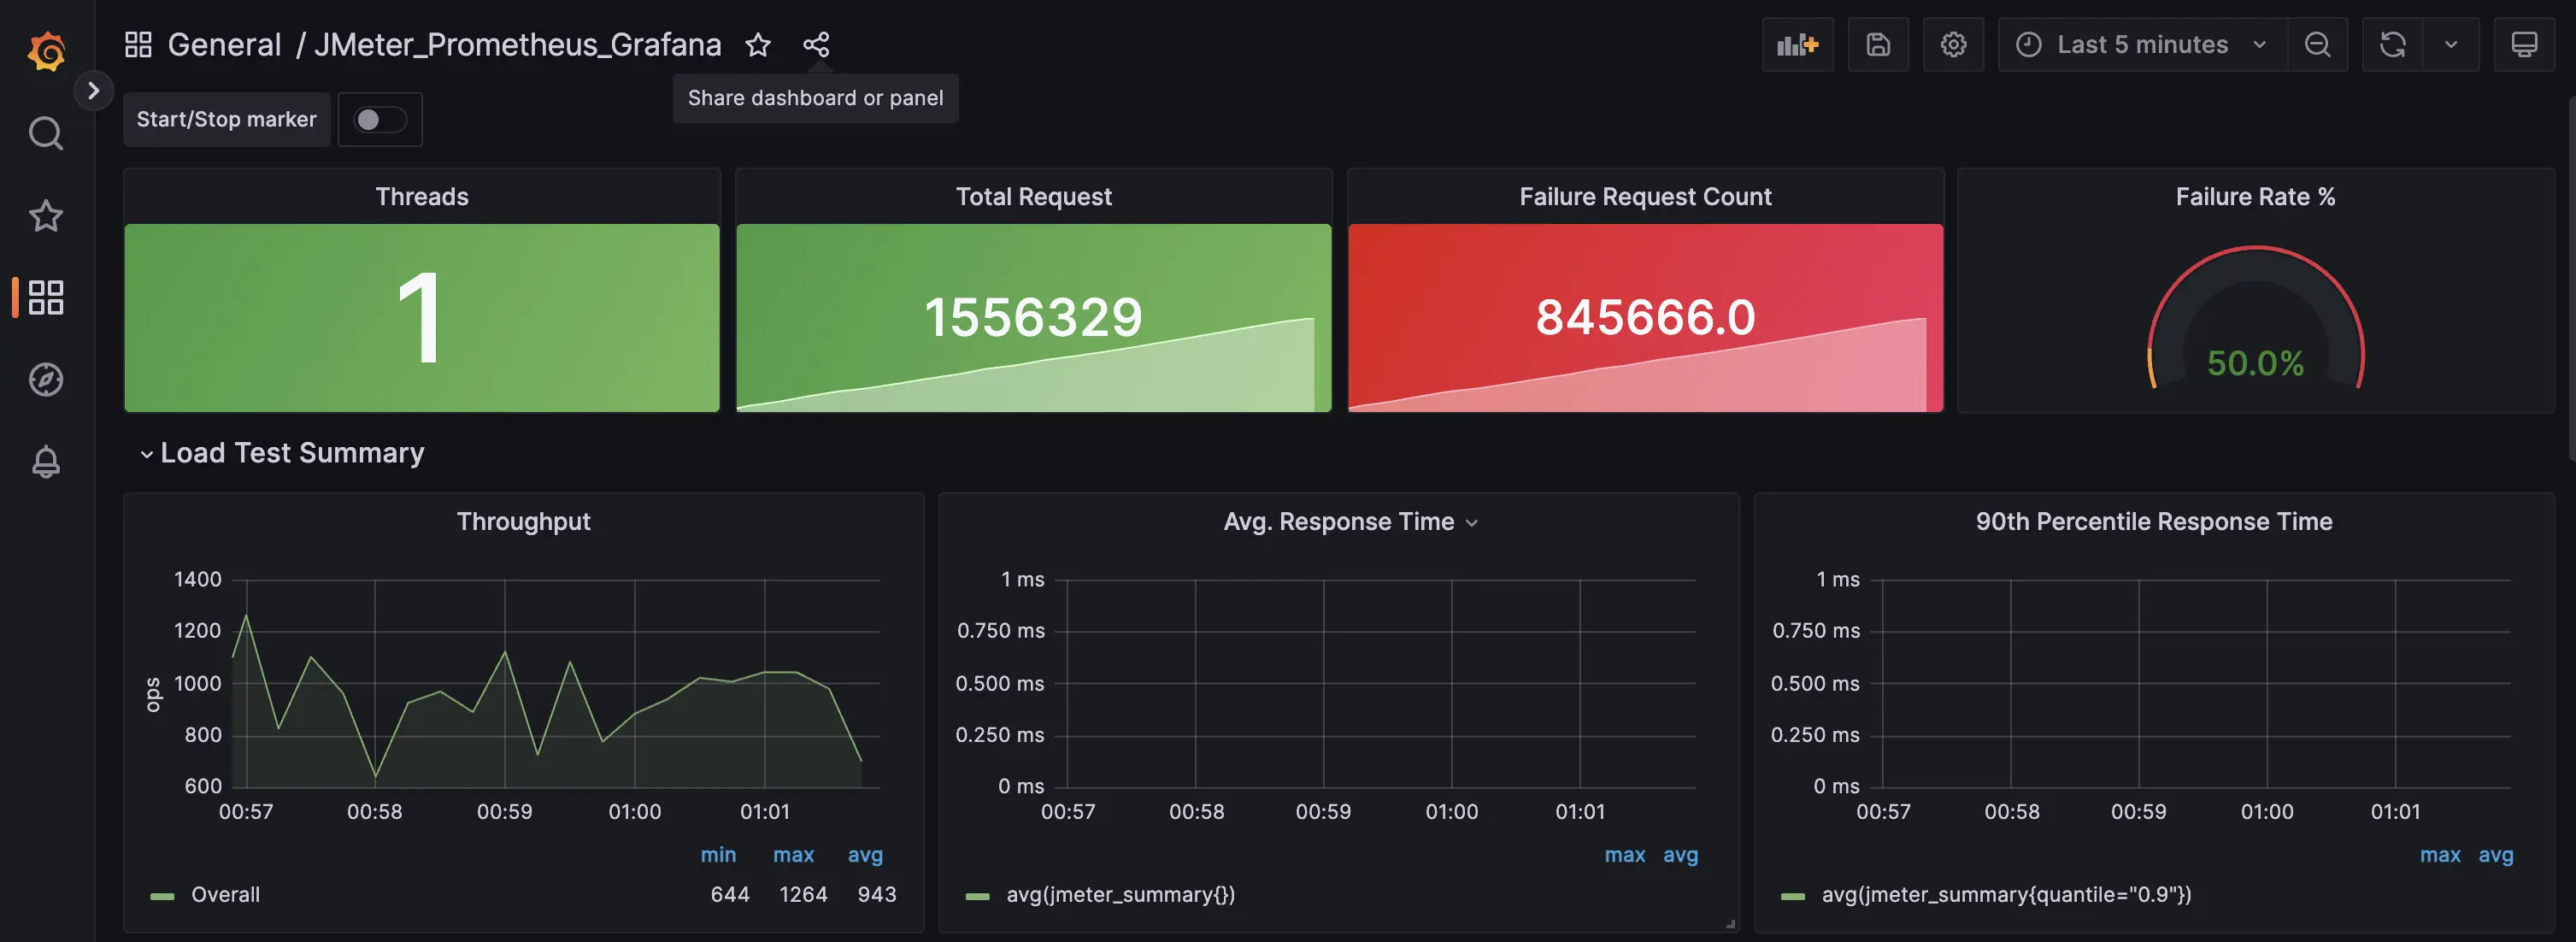
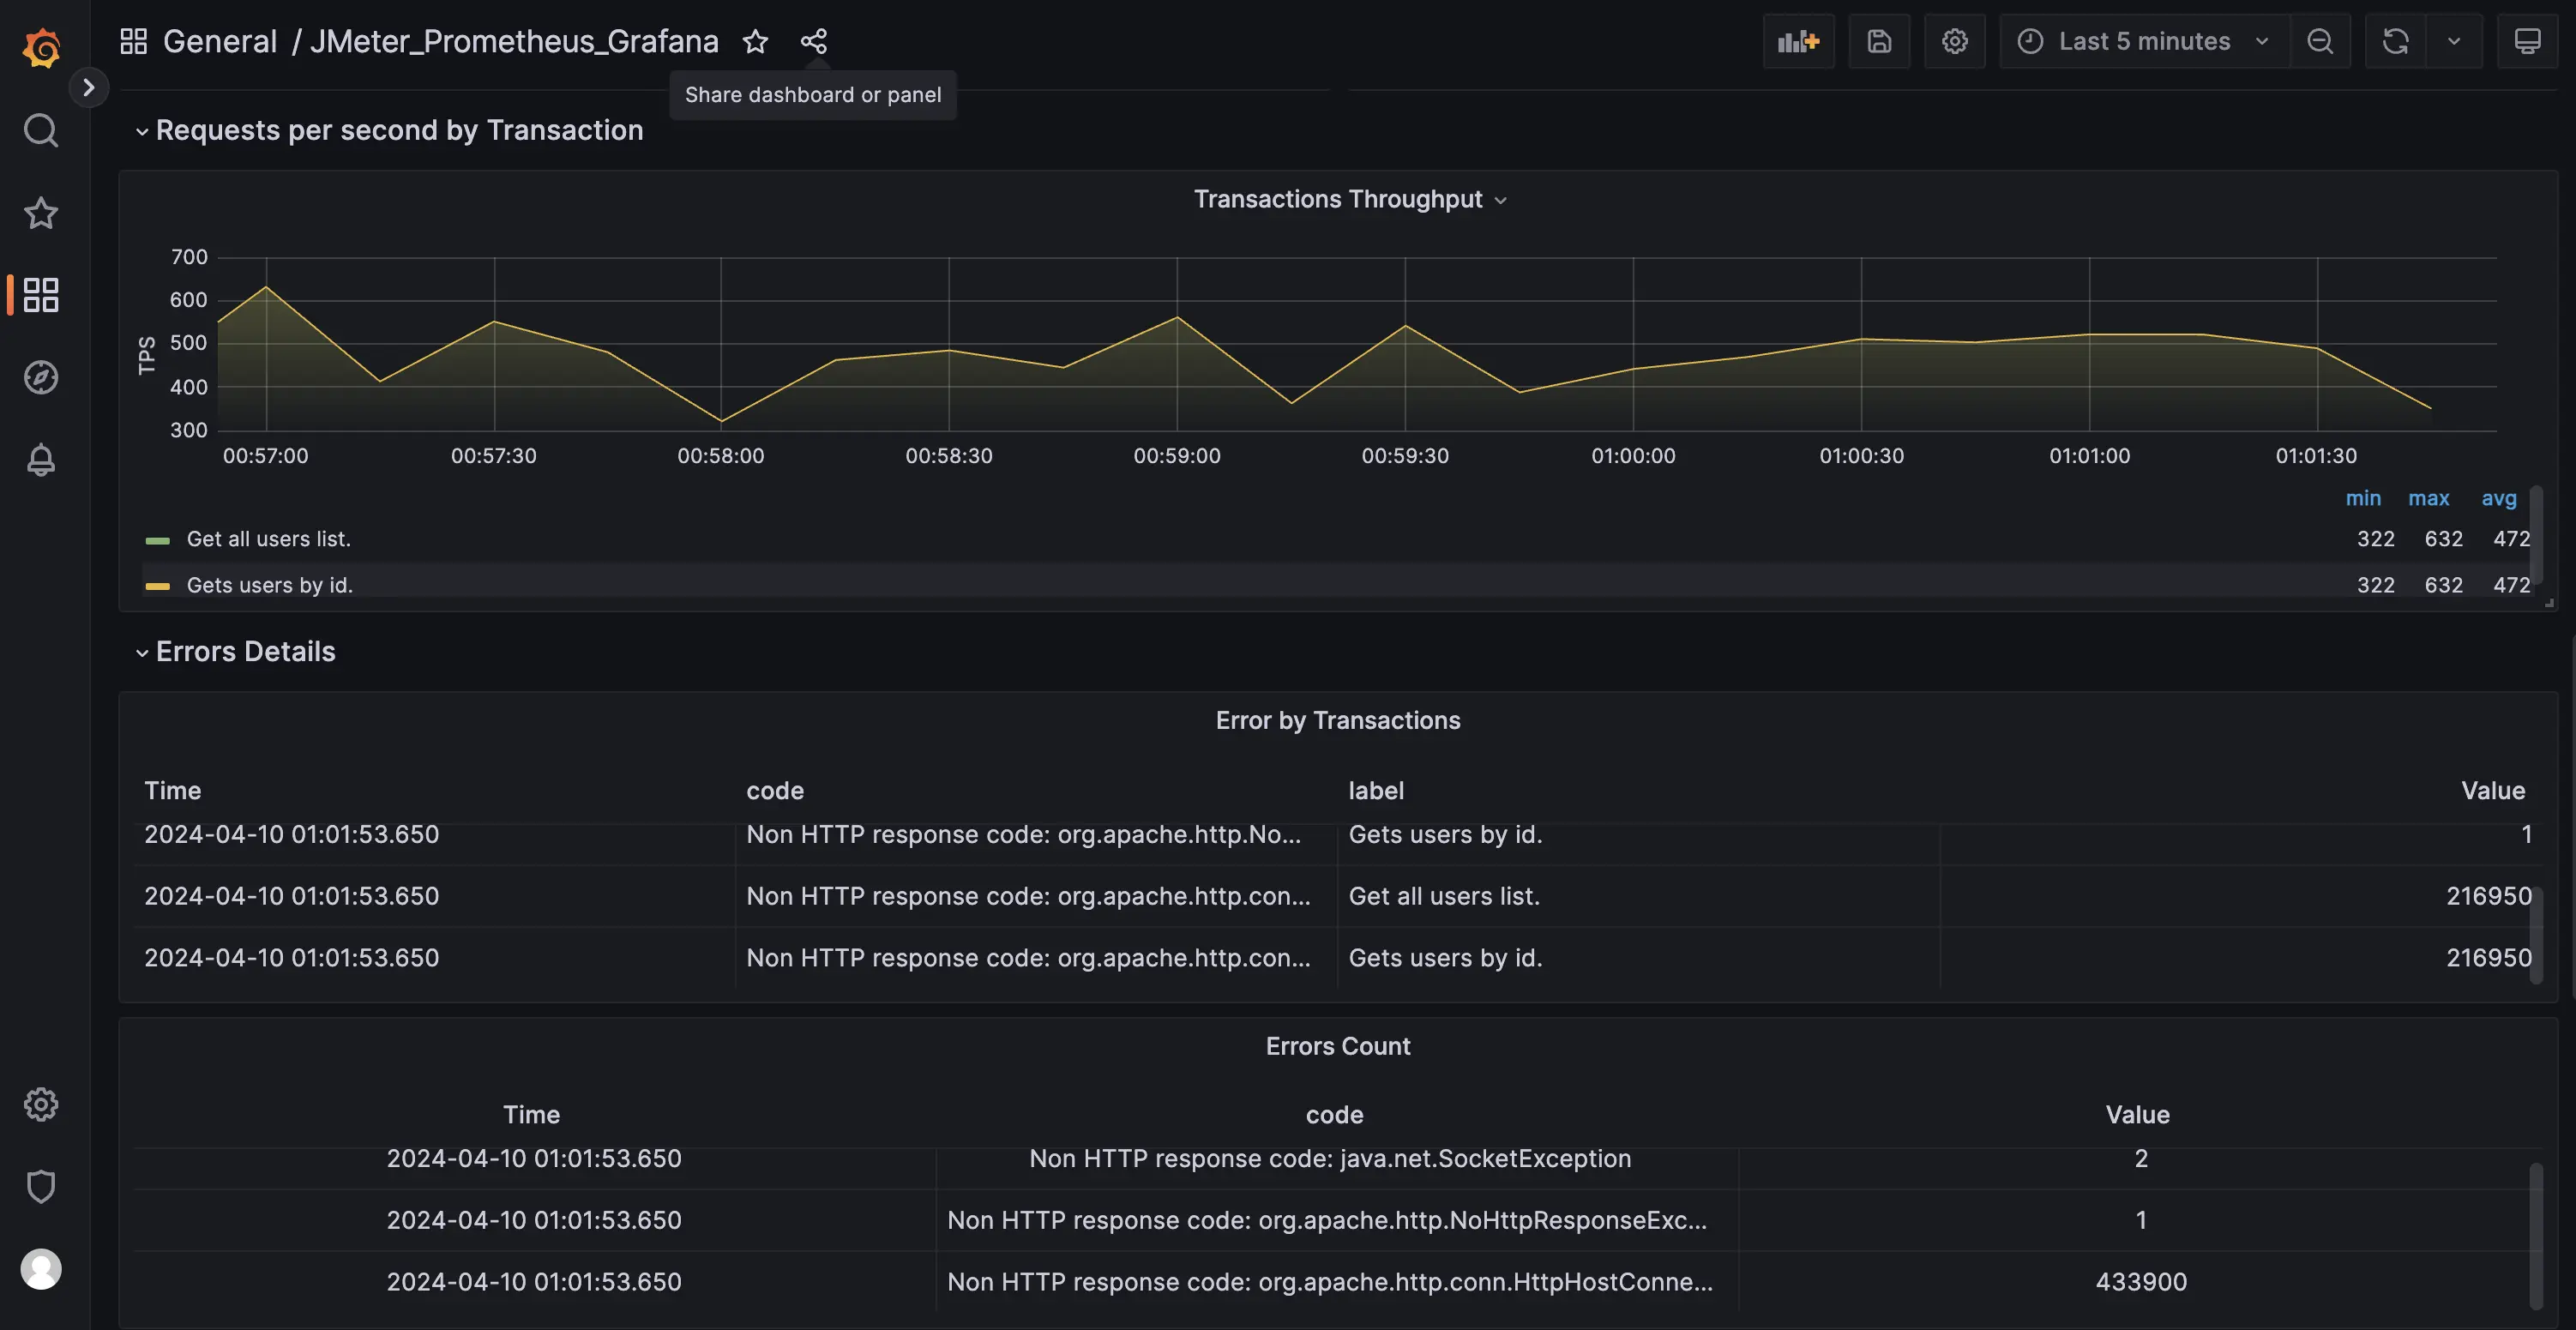
After the template is successfully imported, we will be able to see the entire performance testing monitoring data in Grafana.
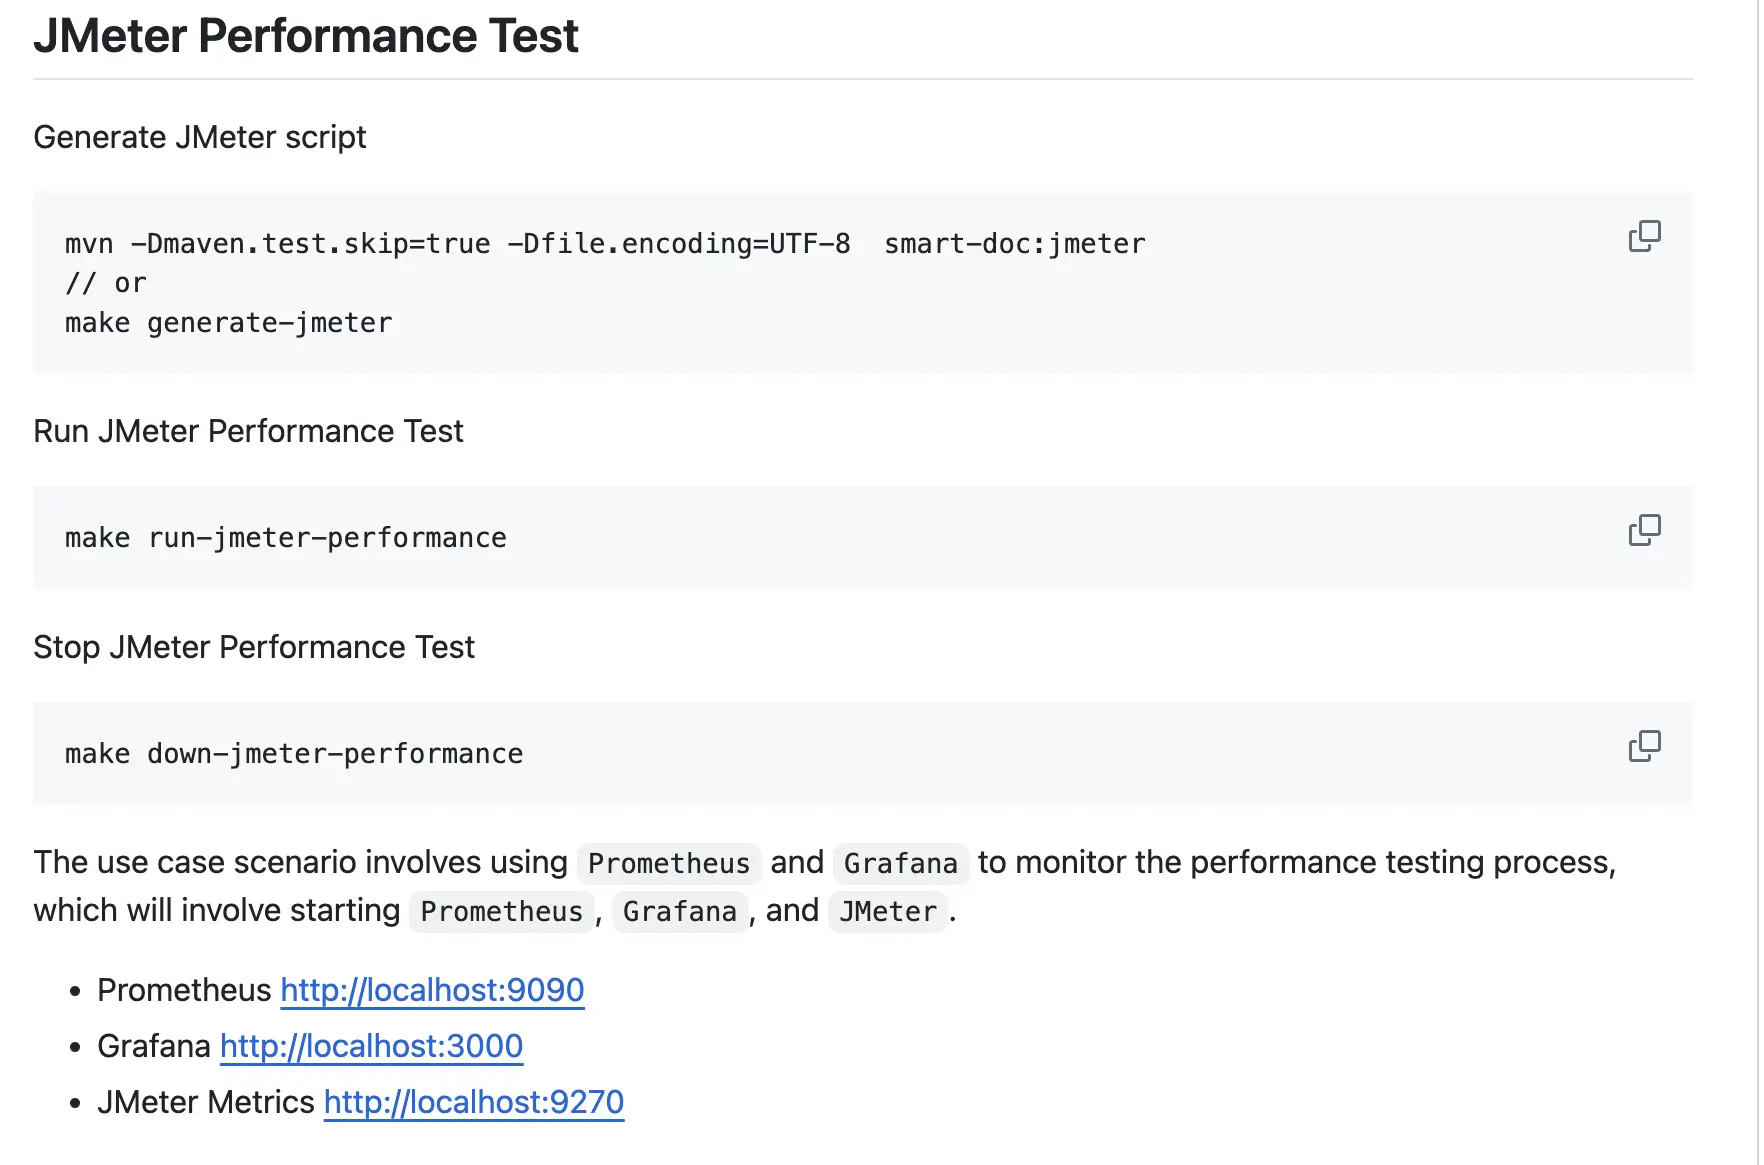
To facilitate a rapid experience of the entire performance testing process, the smart-doc community has curated and provided a template that can be launched with a single command using docker-compose. For those who wish to experience it through Kubernetes deployment, AI tools can be utilized to directly convert the docker-compose template into a Kubernetes deployment template.

The project for the experience also includes usage instructions.
 The example code for this article can be found here.
The Assistance of Smart-Doc in JMeter Performance Testing
The combination of smart-doc and JMeter for performance stress testing offers several advantages:
- Automation:
smart-doccan automatically extract API information from the source code and generate JMeter performance test scripts without the need for manual writing, greatly improving efficiency. - Precision: The JMeter performance test scripts generated by
smart-docare completely consistent with the API definitions in the source code, avoiding errors that may occur when manually writing scripts. - Flexibility:
smart-docsupports a variety of configuration options, allowing the generated JMeter scripts to be customized according to testing requirements.
smart-doc will also continue to improve and optimize support for JMeter. Please stay tuned for the ongoing development of the smart-doc open-source project.
Summary
By combining smart-doc and JMeter, we can not only automate the generation of API documentation but also swiftly create performance test scripts and conduct stress testing. This automation tool significantly enhances development and testing efficiency while helping teams more easily maintain and optimize the performance of software systems. We hope this article has provided practical references for you to apply these tools more efficiently in your daily work.
We also welcome everyone to continue to follow and support the smart-doc open-source community. In the future, we are exploring support for additional languages to assist more developers.
Opinions expressed by DZone contributors are their own.
Comments