Kubernetes Monitoring With Prometheus
Let's discuss the use of Prometheus to monitor Kubernetes and Kubernetes applications.
Join the DZone community and get the full member experience.
Join For FreeKubernetes monitoring is the process of gathering metrics from the Kubernetes clusters you operate to identify critical events and ensure that all hardware, software, and applications are operating as expected. Monitoring is essential to provide insight into cluster health, resource consumption, and workload performance. With the right monitoring, errors that occur in any layer of the stack can be quickly identified and corrected.
There are many Kubernetes monitoring tools, including open-source tools like Prometheus and the ELK Stack as well as commercial tools including Datadog, Cloudwatch, and New Relic.
Of the open-source Kubernetes monitoring tools, Prometheus is among the most popular and widely used. This article discusses the use of Prometheus to monitor Kubernetes and Kubernetes applications.
What Is Prometheus?
Prometheus is an open-source event monitoring and alerting tool that was originally developed at SoundCloud starting in 2012, inspired by the Borgmon tool used at Google. Prometheus has been a Cloud Native Computing Foundation (CNCF) project since 2016; it was the second hosted project after Kubernetes. While this article discusses Prometheus in the context of Kubernetes monitoring, it can satisfy a wide variety of monitoring needs.
Prometheus collects and stores the metrics you specify as time series data. Metrics can be analyzed to understand the operational state of your cluster and its components.
An important focus of Prometheus is reliability. This helps ensure that Prometheus remains accessible if other things are misbehaving in your environment. Each Prometheus server is stand-alone. A local time series database makes it independent from remote storage or other remote services. This makes it useful for rapidly identifying issues and receiving real-time feedback on system performance for the clusters and apps being monitored.
The main components of Prometheus, including the Prometheus server and the Alertmanager, are shown in the figure below. Prometheus also provides a Pushgateway, which allows short-lived and batch jobs to be monitored. The Prometheus client library supports instrumenting application code. A powerful query language (PromQL) makes it possible to easily query Prometheus and drill down to understand what’s happening. While Prometheus offers a web UI, it is often used in combination with Grafana for more flexible visualization.
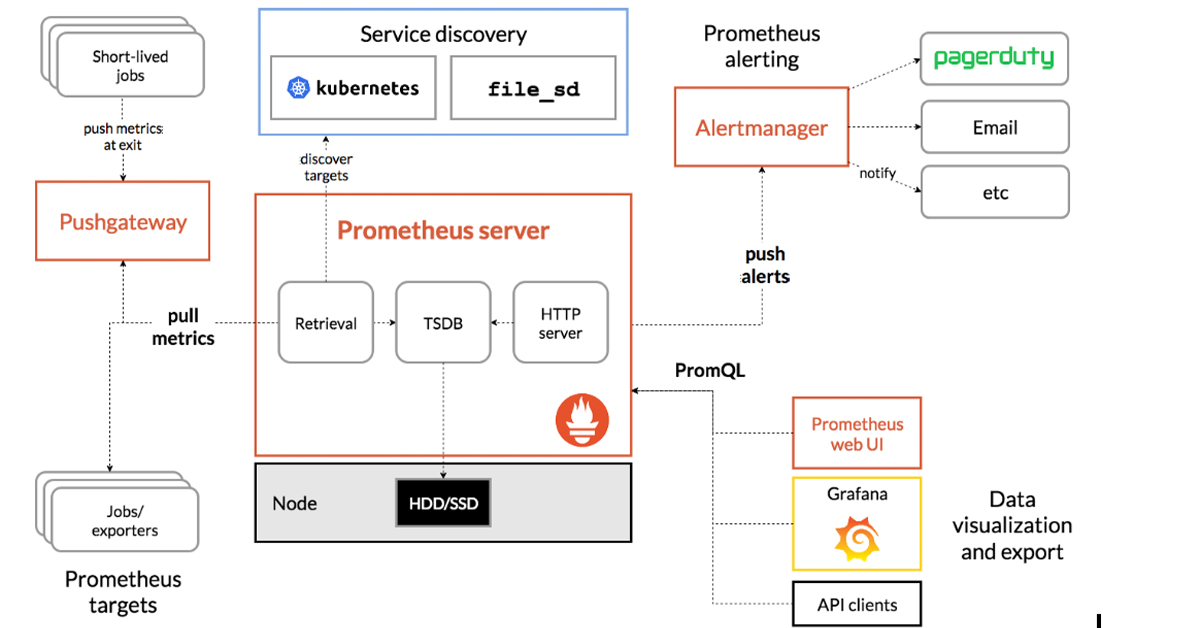
Source: Prometheus.io
One of the things that contributes to the popularity of Prometheus is that many integrations exist, including integrations with various languages, databases, and other monitoring and logging tools. This gives you the flexibility to continue to use the tools and skills you already have.
Planning a Prometheus Deployment
A successful Prometheus deployment requires some up-front planning. First, it’s critical to keep track of who is accessing your clusters and what they are doing so changes can be monitored and rolled back if necessary. You also need to carefully consider what cluster and application metrics you need to collect to help you identify and remediate issues, and what additional visualization tools (if any) you will use to make sense of the data you collect.
Prometheus uses storage efficiently but gathering metrics that don’t add value will consume storage and cost you money. As your deployments become multi-cluster and multi-cloud, it becomes important to balance the value of metrics retained against storage costs. As noted above, Prometheus likes to store metrics locally. Consider and budget for remote storage for longer-term retention if needed.
If you’re going to use Prometheus to monitor in-house Kubernetes applications, you will likely need to develop one or more agents to provide the proper instrumentation. Make sure the output from the agent makes sense to the people who will receive the alerts.
Prometheus Challenges With Large Kubernetes Fleets
The standalone design of Prometheus introduces a certain amount of complexity, especially as your Kubernetes fleet grows to include many clusters — potentially running different Kubernetes distributions in different cloud environments. A large operation with many clusters can easily exceed the capabilities of a single Prometheus server and its associated storage. That means you must either reduce the number of metrics you’re collecting or scale the number of Prometheus servers.
There are several ways to scale your Prometheus backend. Prometheus servers have the ability to scrape data from other Prometheus servers, so you can federate servers. Prometheus supports either a hierarchical or federated model. These approaches require careful planning and add complexity, especially as your operations continue to scale.
Prometheus also provides a way to integrate with remote storage locations through an API that allows writing and reading metrics using a remote URL. This enables you to get all your data in one place, but you’ll need additional tooling to take advantage of that aggregated data. Many organizations add Thanos or Cortex to their toolsets to aggregate data and provide long-term storage and a global view.
While these hurdles aren’t insurmountable, it’s important to think about the additional planning and ongoing management that will be required. Because of the complexity of monitoring large Kubernetes environments, many organizations prefer monitoring as a service.
Published at DZone with permission of Kyle Hunter. See the original article here.
Opinions expressed by DZone contributors are their own.
Comments