Measuring Microservice Latency With HTTPing
Learn how to use ping over HTTP to measure microservice latency. If you can measure it, you can manage it.
Join the DZone community and get the full member experience.
Join For FreeSummary
Httping is like ping but for http-requests.
Latency for MicroServices is defined as the time it takes to send a request and the time it takes for the result to be returned. Various parts of the system can effect the latency, some of which may include
- Network transit
- Hardware
- Application design
- Security
Measuring our latency over time can help us better understand bottlenecks.
Architecture
While there are many different tools that are useful to understanding the performance of our systems and where bottlenecks may occur, it's often the basic tools which help us begin our understanding.
HTTPing is one such basic tool. Its premise is based upon the Unix ping command, which sends ICMP packets to the system under test. The system receiving the ping sends a response which allows the sender to measure the latency between the two systems.
Ping can measure the fastest, average and maximum time between request/response. Failures to respond can help to pinpoint a disruption of service between the systems and is an effective diagnostic for determining connectivity.
But, what if you're running in an environment where ICMP isn't allowed? Or, maybe you would just like more granular details about how your TCP servers are working, header details, response data? This is the Use Case for HTTPing.
With HTTPing, you enter the URL of your TCP server, and it can show
- The time it takes to connect
- Time to send a request
- Time to retrieve the response
- Header and response data
HTTPing provides a more accurate picture of server details, the latency of the server and the network.
Getting Started
There's a couple of choices for getting started with HTTPing, you can download the code from the author's site, install as a Linux package or run a Docker container.
The examples which follow will be based on the Docker container running HTTPing and the first invocation you make will download the Docker image. The next two sections provide background information of you would like to install the standalone Unix version or learn more about the Docker instance.
Where to Get HTTPing
Download or learn more about HTTPing from the author's website here.
HTTPing in Docker
The Docker container we'll be using was created by Captain Bret Fisher (a real Docker Captain).
His image is based on Debian Stretch, a lightweight minimal image and is built using the latest HTTPing code from the author's Git repository.
You can learn more about Bret's Dockerfile here.
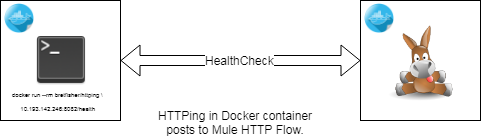
Mule Health Check
You can use the Mule health check for the examples which follow or just about any TCP server, I've also provided a simple Docker example later in the article which you can spin up with minimal effort.
For most of our Mule based MicroServices we implement a health check flow which responds with some basic information to the requestor, which for us is usually an AWS API Gateway or Kong API Gateway. The Gateway uses this information to determine which instance to direct its requests to or if it's necessary to autoscale.
Here's what the simple Mule flow looks like:
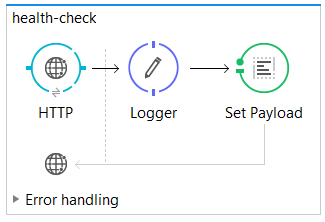
Simple Mule Health Check
<flow name="health-check">
    <http:listener config-ref="HTTP_REST_Listener" path="/health" doc:name="HTTP">
        <http:response-builder statusCode="200" reasonPhrase="All's well that end's well!"/>
    </http:listener>
    <logger message="Health check requested" level="INFO" doc:name="Logger"/>
    <set-payload value="uService on #[InetAddress.getLocalHost().getHostName()] sez ... i'm Okay." doc:name="Set Payload"/>
</flow>
Playing With HTTPing
In the exercises below, we'll show some basic usage examples for HTTPing. The examples will be run using the sample Mule flow above. Mule isn't necessary for the examples, just about any HTTP service should work fine.
If you would like to use another simple HTTP Service rather than the Mule example above, consider spinning up this Docker service to try out the examples with, see my DZone article here.
Getting help:
docker run --rm bretfisher/httping --helpThe first time the Docker run command is invoked will result in downloading the image from Docker Hub and running the HTTPing command. Subsequent invocations will be much faster.
Be sure to replace my ip address with the IP address or FQDN of your server.
As you can see there's plenty of options you can provide to HTTPing to help get your arms around latency issues with your server, we'll explore some of these options in the examples below.
Basic latency test:
# ping until ^C
docker run --rm bretfisher/httping 10.193.142.246:8082/health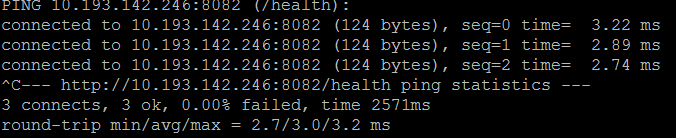
The basic latency will run continuously and display the round-trip transit time for each request to the server. You can stop the command by typing ^C. When the command stops you'll see a summary for the test showing failures, fastest request, average time and the longest request time.
Should you get no response at all you might check the route to your server or SSH to the server and launch the same request from there. By dividing a larger flow into smaller segments you will gain insights into where failures and performance problems are occurring.
Colorize your response:
# ping every 100ms, use GET not HEAD, show status codes, use pretty colors
docker run --rm bretfisher/httping -i .1 -G -s -Y 10.193.142.246:8082/health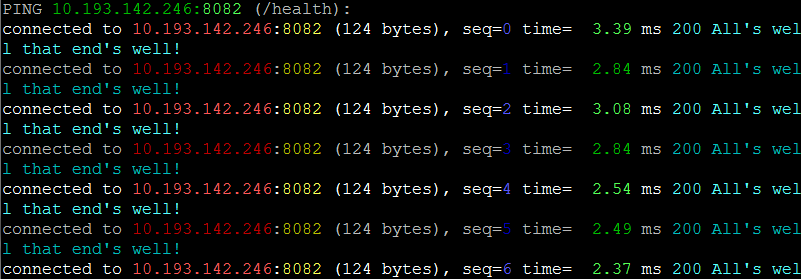
In the color version, we are also including the response data from the server request using the -G switch. The -i switch specifies the interval, which in the example above is 100msec. The HTTP status code (200) is displayed for us compliments of the -s switch.
Colorized response, with limits:
# ping every .5s, use GET not HEAD, color responses over 299msec Red, 275msec Yellow
docker run --rm bretfisher/httping -i .5 -G -s -Y --threshold-red 3.0 \
    --threshold-yellow 2.75 10.193.142.246:8082/health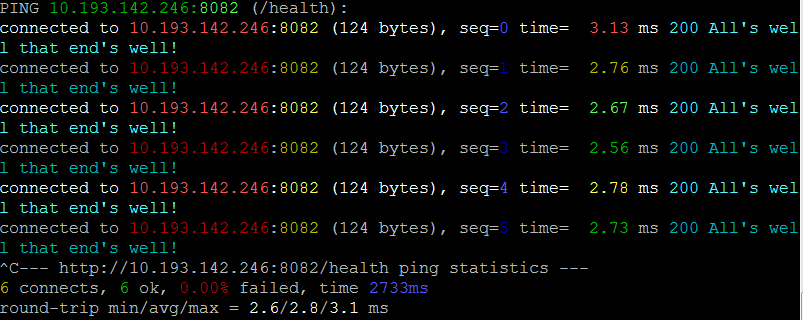
In this example, we apply some limits to what we feel is acceptable in terms of latency. For our example, we've arbitrarily decided that a latency of 2.75 msec should result in a Yellow caution advisory and a latency of 3.0 msec should be displayed in Red.
Run 3 times and stop:
# ping 3 times, use GET not HEAD, show status codes, use pretty colors
docker run --rm bretfisher/httping -c 3  -G -s -Y 10.193.142.246:8082/health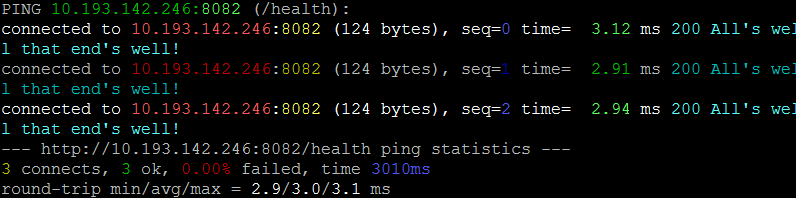
With this run we pass the -c switch with a count of 3 to run the test 3 times and stop. Sometimes, we're less interested in running some number of tests over a time period and more interested in finding out if we have a path to our server, so we limit the test to some number of requests.
Fancy graphs
# add a -it to run command and a -K
docker run --rm bretfisher/httping -i .5 -GsYK 10.193.142.246:8082/health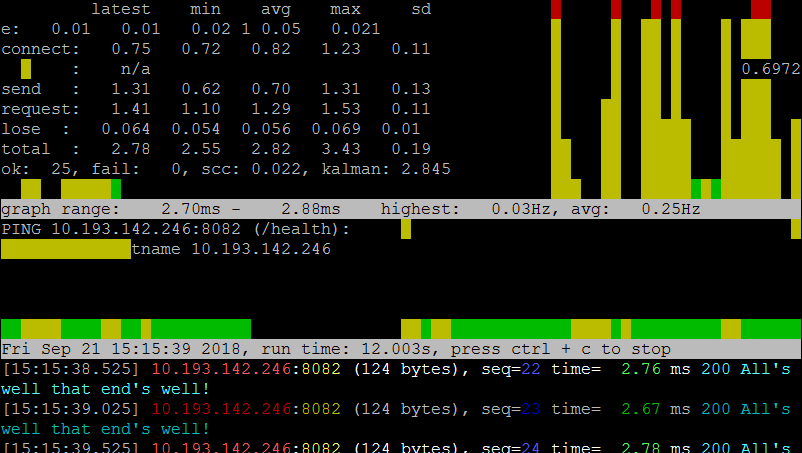
The -K switch provides a graphic representation of the system under test using the Unix curses package. the display will run continuously until you stop it with ^C.
These examples inspired from the --help command should get you well on your way to understanding latency problems with microservices.
I hope you enjoyed reading this article as much as I have enjoyed writing it, I'm looking forward to your feedback!
Opinions expressed by DZone contributors are their own.
Comments