Observability in Spring Boot 4
Bridge observability gaps in Spring Boot 4 by injecting Micrometer Trace IDs via SQL comments and propagating context through Kafka.
Join the DZone community and get the full member experience.
Join For FreeIn microservices, you’ve likely broken a cold sweat more than once when a request suddenly 'vanishes' the moment it hits a Database or a Message Broker. It is a true operational nightmare. However, with the release of Spring Boot 4 in early 2026, building a comprehensive Observability system has become easier than ever, thanks to the 'all-in' support from micrometer tracing.
The Problem: "Anonymous" Queries
When your database starts lagging (slow queries), you check the processlist in MySQL only to find a vague line:
SELECT * FROM orders WHERE status = 'PENDING' ...
At this point, the ultimate head-scratcher arises: "Who triggered this? Which API is executing this statement?" Without a Trace ID embedded directly into the query, you are guaranteed to spend hours digging through logs just to piece the two ends together.
The Solution: "Pinning" Trace IDs Directly into SQL Comments
With Spring Boot 4, we no longer need complex third-party libraries or clunky, "home-brewed" workarounds. Everything is now handled seamlessly through Spring Boot Actuator and Hibernate StatementInspector.
The concept is simple: we attach the Trace ID directly to the SQL statement as a comment. When looking at the Database logs, you will know exactly where that request originated.
Project Setup
Let’s start by initializing a Spring Boot 4.0.2 project with the following structure:
File: build.gradle
To unlock the power of Observability, you will need to include these key dependencies in your configuration file:
plugins {
    id 'java'
    id 'org.springframework.boot' version '4.0.2'
    id 'io.spring.dependency-management' version '1.1.7'
}

group = 'org.example'
version = '0.0.1-SNAPSHOT'
description = 'demo-trace'

java {
    toolchain {
        languageVersion = JavaLanguageVersion.of(17)
    }
}

repositories {
    mavenCentral()
}

dependencies {
    implementation 'org.springframework.boot:spring-boot-starter-data-jpa'
    implementation 'org.springframework.boot:spring-boot-starter-web'
    implementation 'org.springframework.boot:spring-boot-starter-actuator'
    implementation 'io.micrometer:micrometer-tracing-bridge-otel'
    implementation 'com.mysql:mysql-connector-j'
    compileOnly 'org.projectlombok:lombok'
    annotationProcessor 'org.projectlombok:lombok'
}

tasks.named('test') {
    useJUnitPlatform()
}
Implementing the SQL Inspector
Now, we will create a class that acts as a "gatekeeper" to intercept and modify every SQL statement just before it is sent to the Database.
File: SqlCommentStatementInspector.java
Here is how we use Hibernate's StatementInspector to automatically inject the Trace ID into your queries:
package org.example.demotrace;

import lombok.extern.slf4j.Slf4j;
import org.hibernate.resource.jdbc.spi.StatementInspector;
import org.slf4j.MDC;
import java.net.InetAddress;

@Slf4j
public class SqlCommentStatementInspector implements StatementInspector {
    private static String HOST_NAME;
    static {
        try {
            HOST_NAME = InetAddress.getLocalHost().getHostName();
        } catch (Exception e) {
            log.error("Cannot get local host name", e);
            HOST_NAME = "unknown-host";
        }
    }

    @Override
    public String inspect(String sql) {
        // Elastic APM Agent auto add traceId vào MDC with key "traceId"
        String traceId = MDC.get("traceId");
        if (traceId == null) traceId = "no-trace";

        return sql + " /* host: " + HOST_NAME + "; traceId: " + traceId + " */";
    }
}
To complete the process, we need a "bridge" to ensure the Trace ID is always available within the context of each request. Below is how we set up a Filter to manage this.
Linking the Trace ID to MDC (Mapped Diagnostic Context)
For the SqlCommentStatementInspector to accurately retrieve the Trace ID, we must ensure this information is pushed into the MDC. We will implement a standard Servlet Filter to handle this "identification" process the moment a request hits the system.
File: TraceIdFilter.java
This code snippet synchronizes the Trace ID from Micrometer into the Log context, ensuring that both your log files and SQL comments are "aligned under a single source of truth":
package org.example.demotrace;

import jakarta.servlet.*;
import jakarta.servlet.http.HttpServletRequest;
import jakarta.servlet.http.HttpServletResponse;
import org.slf4j.MDC;
import org.springframework.stereotype.Component;

import java.io.IOException;
import java.util.UUID;

@Component
public class TraceIdFilter  implements Filter {

    private static final String TRACE_ID_HEADER = "X-Trace-Id";
    private static final String TRACE_ID_MDC_KEY = "traceId";

    @Override
    public void doFilter(ServletRequest request, ServletResponse response,
                         FilterChain chain) throws IOException, ServletException {

        HttpServletRequest httpRequest = (HttpServletRequest) request;
        HttpServletResponse httpResponse = (HttpServletResponse) response;

        // get trace from header or create
        String traceId = httpRequest.getHeader(TRACE_ID_HEADER);
        if (traceId == null || traceId.isEmpty()) {
            traceId = UUID.randomUUID().toString();
        }

        MDC.put(TRACE_ID_MDC_KEY, traceId);
        httpResponse.setHeader(TRACE_ID_HEADER, traceId);

        try {
            chain.doFilter(request, response);
        } finally {
            // remove trace after done
            MDC.remove(TRACE_ID_MDC_KEY);
        }
    }
}
Hibernate Configuration
To let Spring Boot know it should use the SqlCommentStatementInspector for every database transaction, you only need to declare a single line in your configuration file.
File: application.properties
Add the following line to your configuration file:
spring.application.name=demo-trace
spring.datasource.url=jdbc:mysql://mysql:3306/tracing_db?createDatabaseIfNotExist=true
spring.datasource.username=root
spring.datasource.password=root
spring.jpa.hibernate.ddl-auto=update

# Register statement_inspector
spring.jpa.properties.hibernate.session_factory.statement_inspector=org.example.demotrace.SqlCommentStatementInspector
spring.jpa.show-sql=true

management.tracing.sampling.probability=1.0
logging.pattern.level=%5p [${spring.application.name:},%X{traceId:-},%X{spanId:-}]
Test Run: Create a Data Query API
We will create a UserController to simulate a real user request. When this API is called, Spring Boot 4 will automatically generate a Trace ID, pass it through the filter, attach it to the MDC, and finally embed it into the SQL query.
File: UserController.java
package org.example.demotrace.controller;

import lombok.RequiredArgsConstructor;
import lombok.extern.slf4j.Slf4j;
import org.example.demotrace.entity.User;
import org.example.demotrace.repository.UserRepository;
import org.springframework.web.bind.annotation.*;
import java.util.List;

@Slf4j
@RestController
@RequestMapping("/api/users")
@RequiredArgsConstructor
public class UserController {

    private final UserRepository userRepository;

    @PostMapping
    public User createUser(@RequestBody User user) {
        log.info("Request Success!");

        User rs = userRepository.save(user);
        userRepository.findUserSlowly(rs.getId());
        return rs;
    }

    @GetMapping
    public List<User> getAllUsers() {
        return userRepository.findAll();
    }
}
Entity: User.java
This is the structure of the data table we will be querying. You can use Lombok to keep the code clean and concise as shown below:
package org.example.demotrace.entity;

import jakarta.persistence.*;
import lombok.Data;

@Entity
@Table(name = "users")
@Data
public class User {
    @Id
    @GeneratedValue(strategy = GenerationType.IDENTITY)
    private Long id;
    private String name;
    private String email;
}
Repository: UserRepository.java
Implementing a simulated slow query to test tracing at the MySQL database layer.
package org.example.demotrace.repository;

import org.example.demotrace.entity.User;
import org.springframework.data.jpa.repository.JpaRepository;
import org.springframework.data.jpa.repository.Query;
import org.springframework.data.repository.query.Param;

import java.util.Optional;

public interface UserRepository extends JpaRepository<User, Long> {

    @Query(value = "SELECT u.*, SLEEP(50000) FROM users u WHERE u.id = :id", nativeQuery = true)
    Optional<User> findUserSlowly(@Param("id") Long id);
}
Docker Compose and Dockerfile for Kibana APM Integration
Below are the Docker Compose and Dockerfile configurations required to run the application and visualize tracing data within Kibana APM.
File: docker-compose.yml
services:
  mysql:
    image: mysql:8.0
    environment:
      MYSQL_ROOT_PASSWORD: root
    volumes:
      # Map file init vào container
      - ./init.sql:/docker-entrypoint-initdb.d/init.sql
    ports:
      - "3306:3306"
    healthcheck:
      test: ["CMD", "mysqladmin" ,"ping", "-h", "localhost"]
      timeout: 20s
      retries: 10

  elasticsearch:
    image: docker.elastic.co/elasticsearch/elasticsearch:7.17.0
    environment:
      - discovery.type=single-node
      - "ES_JAVA_OPTS=-Xms512m -Xmx512m"
    ports:
      - "9200:9200"

  apm-server:
    image: docker.elastic.co/apm/apm-server:7.17.0
    depends_on: [elasticsearch]
    ports: ["8200:8200"]
    command: >
      apm-server -e
      -E output.elasticsearch.hosts=["elasticsearch:9200"]
      -E apm-server.host="0.0.0.0:8200"

  kibana:
    image: docker.elastic.co/kibana/kibana:7.17.0
    depends_on: [elasticsearch]
    ports: ["5601:5601"]

  app:
    build: .
    dns:
      - 8.8.8.8
      - 8.8.4.4
    depends_on:
      mysql:
        condition: service_healthy
      apm-server:
        condition: service_started
    ports:
      - "8080:8080"
Dockerfile:
# Stage 2: run (Runtime)
FROM eclipse-temurin:17-jre-jammy
WORKDIR /app

# Copy file jar
# (need build app from gradle local or ide)
COPY build/libs/demo-trace-0.0.1-SNAPSHOT.jar app.jar

# download agent apm
ADD https://repo1.maven.org/maven2/co/elastic/apm/elastic-apm-agent/1.43.0/elastic-apm-agent-1.43.0.jar elastic-apm-agent.jar

ENTRYPOINT ["java", \
    "-javaagent:/app/elastic-apm-agent.jar", \
    "-Delastic.apm.service_name=demo-trace-service", \
    "-Delastic.apm.server_urls=http://apm-server:8200", \
    "-Delastic.apm.application_packages=org.example.demotrace", \
    "-Delastic.apm.enable_log_correlation=true", \
    "-jar", "app.jar"]
Monitoring and "Crushing" Slow Queries
Now that the coding is finished, let's deploy the environment to verify our results. We will use Docker to simulate a complete, production-ready system.
Deployment with Docker First, build your project (ensure you have JDK 17+ installed): ./gradlew clean build.
Next, spin up the technology stack (including the App, MySQL, and Observability tools): docker compose up -d.
"Tracing" in Action
Imagine you receive an alert that the Database is hanging. You log into MySQL and run the command to inspect the currently executing processes:
SELECT ID,USER,HOST,DB,COMMAND,TIME,STATE,INFO
FROM information_schema.processlist
WHERE COMMAND != 'Sleep' AND INFO IS NOT NULL ORDER BY TIME DESC;
The result will look like this:
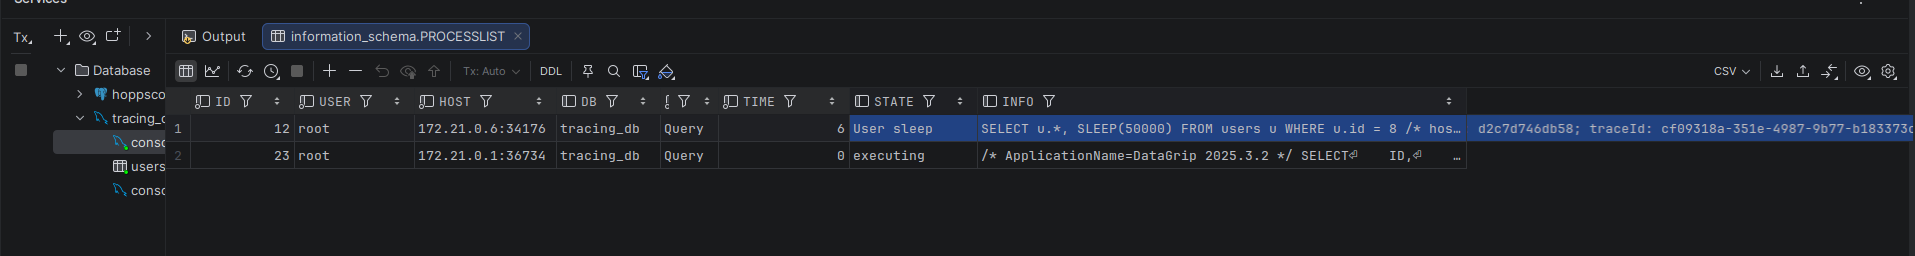
Why Is This a "Lifesaver"?
- Identify the culprit: Looking at the Info column, you can immediately see the
traceId=6794d2e1b.... - Backtrace with ease: Simply copy this Trace ID and paste it into your log management system (such as Grafana Loki or ELK). Instantly, you’ll uncover the request's entire journey: where it started, which user triggered it, and exactly why it’s lagging.
- Decisive action: If this query is hanging the system, you can confidently execute
KILL 12(the process ID) because you know exactly which feature it belongs to and what the impact of killing it will be.
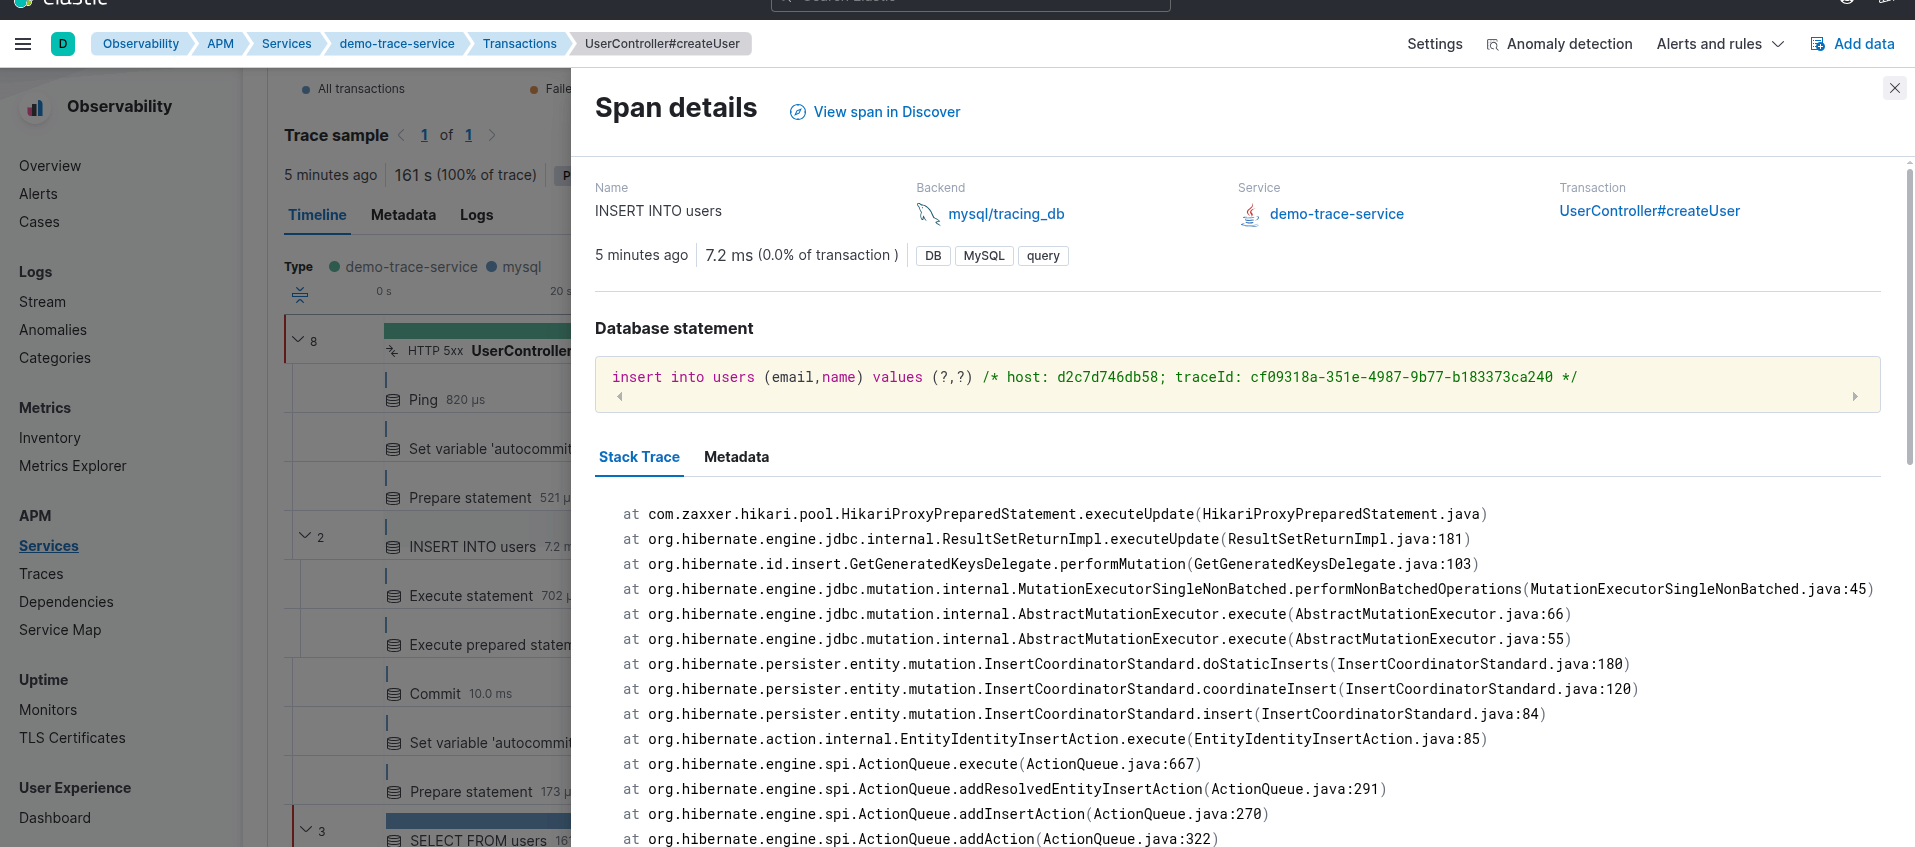
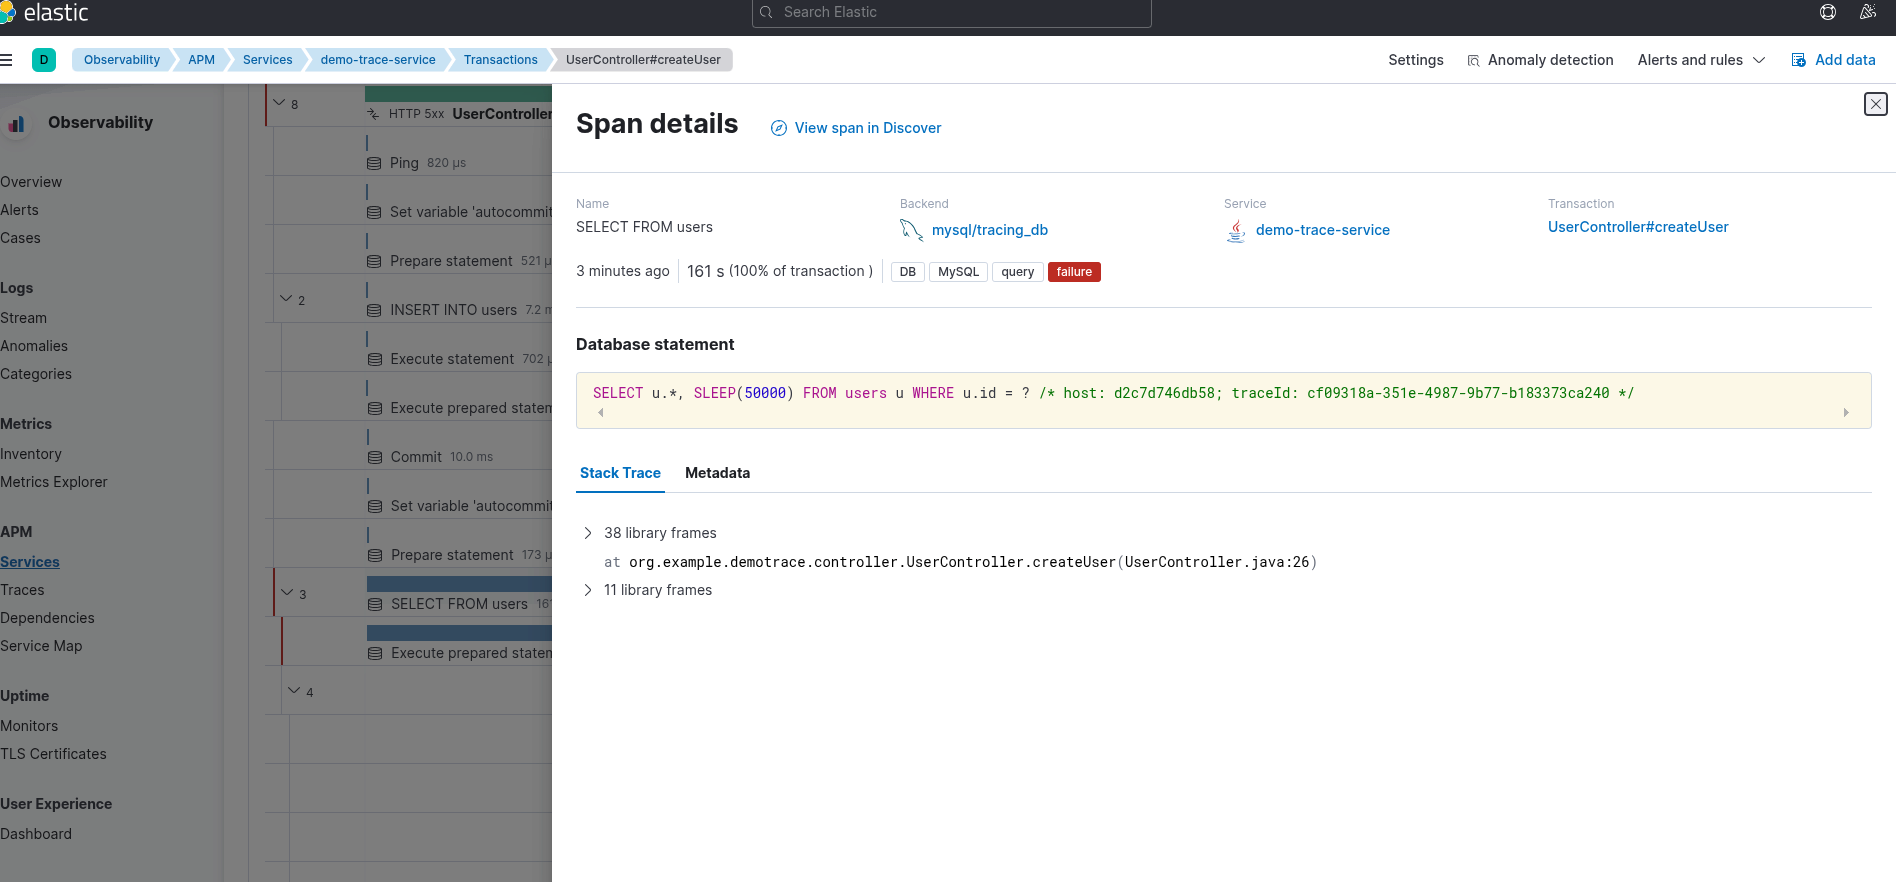
Lightning-Fast Backtracing
This is the "money shot" — the most valuable part of the entire process. Once you’ve identified a "culprit" query in the database, finding its origin takes only a few seconds:
- Extract the trace: Copy the
traceIdfrom the INFO column in the MySQLSHOW PROCESSLISToutput. - Search on Kibana: Navigate to your Kibana dashboard (typically at
http://localhost:5601). - Paste and search: Paste the
traceIdinto the search bar. - The big reveal: Kibana will instantly display every log entry associated with that ID. You will discover:
- Which user was performing the action.
- Which service sent the request.
- The input parameters provided to that specific API.
- And even the preceding processing steps and how much time each one consumed.
Application logs from the service environment:
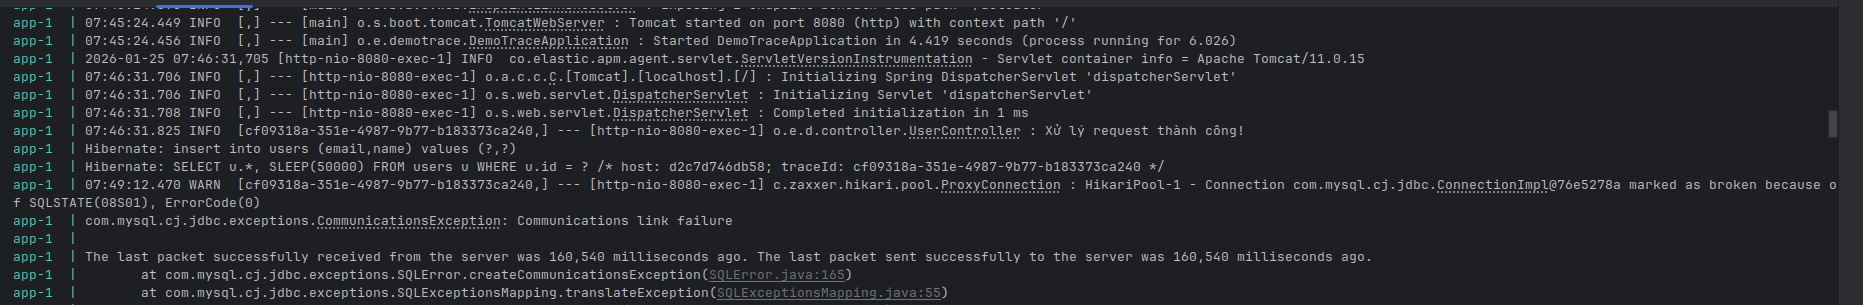
Every trace now provides end-to-end visibility, spanning from the initial user request, cutting through the application layer, and reaching down to the deepest database level.
Leveling Up: Tracing Through CDC and Kafka
Real-world systems don't just stop at the database. When you need to synchronize data across other services via change data capture (CDC) and Kafka, the Trace ID acts as a "Golden Thread" connecting every link in the chain.
- CDC (e.g., Debezium): When scanning the Database Binlog, the CDC capture process picks up the SQL content — including the comments containing the Trace ID we embedded. You can then extract this ID and include it in the Event Metadata.
- Kafka headers: Spring Boot 4 provides native support for context propagation. When Service A sends a message to Kafka, this identifier is automatically "injected" into the Kafka Header.
- Scalability: Service B (the Consumer) will automatically restore the context from that Header, continuing to log activities under the same unique Trace ID.
Summary
The synergy between Spring Boot 4, SQL Comment Tracing, and Kafka CDC creates an incredibly robust monitoring ecosystem:
- Transparency: You gain a crystal-clear understanding of the "origin story" behind every single database query.
- Loose coupling: You can freely scale and expand your services without the fear of requests "vanishing" or losing their trail.
- Performance: You can fully leverage Kafka's asynchronous processing power while maintaining comprehensive, end-to-end observability.
Opinions expressed by DZone contributors are their own.
Comments