

Supply Chain Resilience Analysis With Apache Spark and Neo4j
We model a supply chain in Neo4j using Apache Spark to load data, NetworkX to identify critical nodes, and Cypher to find alternative routes after a disruption.
 CORE
·
CORE
·
Join the DZone community and get the full member experience.
Join For FreeSupply chains are graphs. Suppliers feed into warehouses, warehouses feed into distribution centers, and distribution centers feed into retailers. When we model them that way — as nodes and relationships rather than rows and columns — we unlock a set of tools that gives us the ability to ask questions about connectivity, paths, and the structural importance of individual nodes.
In this article, we'll build a supply chain, load it into Neo4j via Apache Spark, use NetworkX to identify the most critical nodes in the network, and then simulate a real-world disruption to find alternative routes.
The full source code is available on GitHub.
The Stack
Each tool in the stack does what it does best:
| Tool | Role |
|---|---|
| Apache Spark (local mode) | Data generation, transformation, and loading into Neo4j |
| Neo4j (remote, AuraDB) | Graph storage and native variable-length path queries |
| NetworkX | Betweenness centrality - identifying the most critical nodes |
| Plotly | Interactive visualization throughout |
One tool conspicuously absent from this list is Neo4j's Graph Data Science (GDS) library. We'll come back to why and what to reach for when you outgrow the approach described in this article.
Setting Up Neo4j AuraDB
AuraDB is Neo4j's fully managed cloud database. A free tier is available with no credit card required.
- Sign up at console.neo4j.io/graphacademy.
- Create a new AuraDB Free instance.
- When the instance is created, download or note the credentials - the connection URI, username, and password. Neo4j only shows the password once, so save it somewhere safe.
- Once the instance is running, open the built-in Query tab and verify connectivity:
cypher MATCH (n) RETURN count(n). This should return0. We are ready to load data.
Before starting Jupyter, export the connection details as environment variables in your shell:
export NEO4J_URI=neo4j+s://xxxx.databases.neo4j.io
export NEO4J_USERNAME=your_username_here
export NEO4J_PASSWORD=your_password_here
export NEO4J_DATABASE=your_database_name_here
The notebook reads these at startup and raises an error immediately if any are missing.
The Data Model
The supply chain has four layers connected by SHIPS_TO relationships:
Suppliers -> Warehouses -> Distribution Centers -> RetailersEach SHIPS_TO relationship carries three properties:
cost(shipping cost in dollars)distance(km)capacity(maximum units per shipment)
We'll generate a synthetic but reproducible dataset using Faker and NumPy with a fixed random seed, giving us 20 suppliers, 12 warehouses, 10 distribution centers, and 30 retailers with 125 routes across all three layers.
Loading the Graph With Spark
Spark earns its place in the pipeline by handling the loading step. The Neo4j Spark Connector translates Spark DataFrames into Cypher MERGE statements under the hood, handling the graph write for us:
spark = (
    SparkSession.builder
    .master("local[*]")
    .appName("SupplyChainResilience")
    .config("spark.jars.packages", SPARK_CONNECTOR)
    .config("neo4j.url", NEO4J_URI)
    .config("neo4j.authentication.basic.username", NEO4J_USERNAME)
    .config("neo4j.authentication.basic.password", NEO4J_PASSWORD)
    .getOrCreate()
)
The connector JAR resolves automatically from Maven Central on first run. In a real pipeline, this step would read from S3, a data warehouse, or a Kafka topic and stream records into Neo4j continuously.
One important detail is that we'll clear the database before each load using Cypher's IN TRANSACTIONS syntax so each run starts from a clean slate:
MATCH (n)
CALL (n) { DETACH DELETE n }
IN TRANSACTIONS OF 10000 ROWS
We'll then confirm the database is empty before writing new data to the database.
Betweenness Centrality With NetworkX
Betweenness centrality answers a specific question: if we looked at every possible shortest path between every pair of nodes in the network, how often does each node appear on one of those paths?
A node with high betweenness acts as a bridge through which many shortest paths pass. If it disappears, many routes break. A node with low betweenness is peripheral - the network barely notices if it goes offline.
We'll pull the graph out of Neo4j via Spark into a NetworkX DiGraph and compute centrality using shipping cost as the edge weight, so the algorithm finds shortest paths by lowest cost rather than fewest hops:
edges_sdf = (
    spark.read.format("org.neo4j.spark.DataSource")
    .option("query",
        "MATCH (a)-[r:SHIPS_TO]->(b) "
        "RETURN coalesce(a.id, a.name) AS source, "
        "       coalesce(b.id, b.name) AS target, "
        "       r.cost AS cost")
    .load()
)
edges_pd = edges_sdf.toPandas()

G = nx.DiGraph()
for _, row in edges_pd.iterrows():
    G.add_edge(row["source"], row["target"], weight = row["cost"])

centrality = nx.betweenness_centrality(G, weight = "cost", normalized = True)
Figure 1 shows the full supply chain network before any disruption. Each node type is color-coded: suppliers in blue, warehouses in orange, distribution centers in teal, and retailers in red-orange. The density of connections between layers gives a first impression of where bottlenecks might exist.
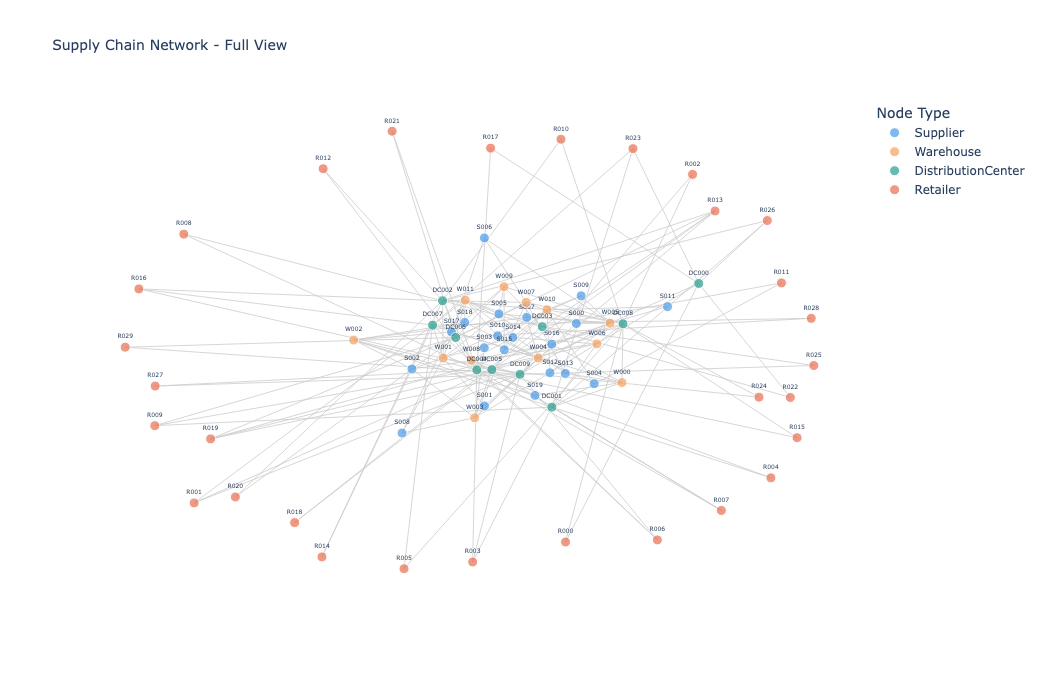
Figure 1. Full Supply Chain Network
Once computed, we'll write the scores back into Neo4j via Spark so Cypher queries can use centrality as a filter or sort key without recomputing it every time.
Figure 2 shows the top 15 nodes ranked by betweenness centrality. The length of each bar reflects how often that node appears on a shortest path between other nodes in the network. A longer bar indicates a node that carries a disproportionate share of shortest-path traffic.
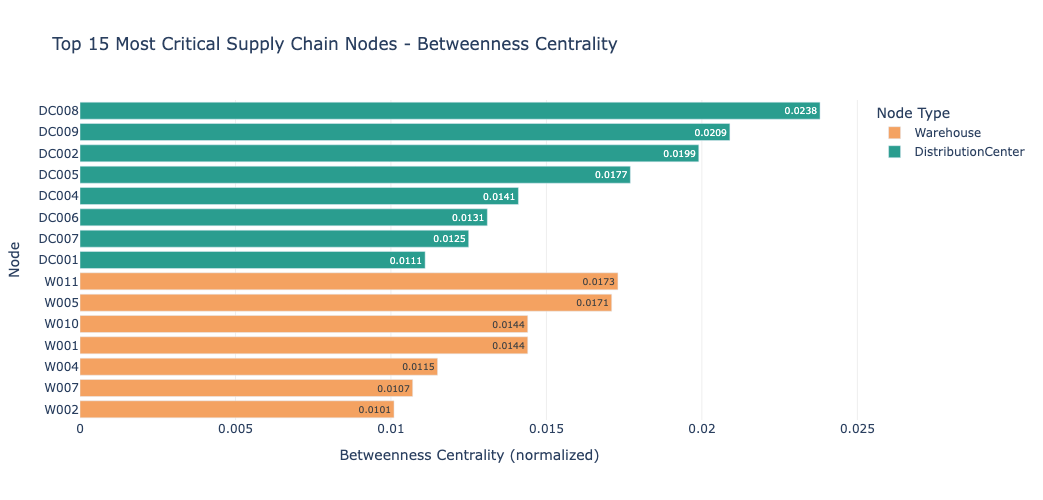
Figure 2. Top 15 Nodes by Betweenness Centrality
Why Not GDS?
Neo4j's Graph Data Science (GDS) library has a native gds.betweenness.stream() procedure that runs the same algorithm inside the database using advanced processing. For our small-node demo dataset, NetworkX is instant and requires no additional setup. But nx.betweenness_centrality() runs in O(n * m) time and loads the entire graph into memory. At tens of thousands of nodes, both of those properties become problems.
That is exactly where GDS comes in. If you are using Neo4j AuraDB, the same algorithm is available through Aura Graph Analytics — a service that connects directly to your AuraDB instance. The rest of the notebook — Spark for data loading, Plotly for visualization, native Cypher for shortest path — works identically on AuraDB without any changes.
Simulating a Disruption
With centrality scores computed, we'll identify the highest-scoring node that is a Supplier or Warehouse and mark it as disrupted in Neo4j:
with driver.session(database = NEO4J_DATABASE) as session:
    session.run(
        "MATCH (n {id: $id}) SET n.disrupted = true",
        id=disrupted_id
    )
We'll deliberately restrict disruption to Suppliers and Warehouses. Distribution centers are fewer in number, and each carries more routing burden, making them more likely to be sole bridges whose removal severs the network entirely. A warehouse disruption is a more realistic scenario and produces richer alternative-route results.
Finding Alternative Routes With Native Cypher
With the disrupted node flagged, we'll use Neo4j's built-in variable-length path matching to find alternative routes that avoid it:
MATCH (s:Supplier), (r:Retailer)
WHERE s.disrupted IS NULL
  AND r.disrupted IS NULL
MATCH path = (s)-[:SHIPS_TO*..6]->(r)
WHERE none(n IN nodes(path) WHERE n.disrupted IS NOT NULL AND n.disrupted = true)
WITH s, r, path,
     reduce(
         cost = 0.0,
         rel IN relationships(path) | cost + rel.cost
     ) AS total_cost
ORDER BY total_cost ASC
RETURN
    s.id AS source,
    r.id AS target,
    [n IN nodes(path) | coalesce(n.id, n.name)] AS path_nodes,
    round(total_cost, 2)                        AS total_cost,
    length(path)                                AS hops
LIMIT 10
This query is available on both local Neo4j and AuraDB with no additional plugins required. A typical result looks like this:
source  target  total_cost  hops
  S006    R001       94.35     3
  S007    R026      148.86     3
  S007    R017      155.19     3
  S019    R026      165.88     3
The cheapest alternative route bypasses the disrupted node entirely at a total shipping cost of $94.35.
Note that MATCH (s:Supplier), (r:Retailer) creates a cartesian product for every Supplier/Retailer pair, which is fine for our small dataset. For larger graphs, you would normally constrain the source and destination.
The network after disruption is shown in Figure 3. The disrupted node is highlighted in red, and the best alternative route is shown in green, tracing the lowest-cost path from supplier to retailer that avoids the failed node entirely.
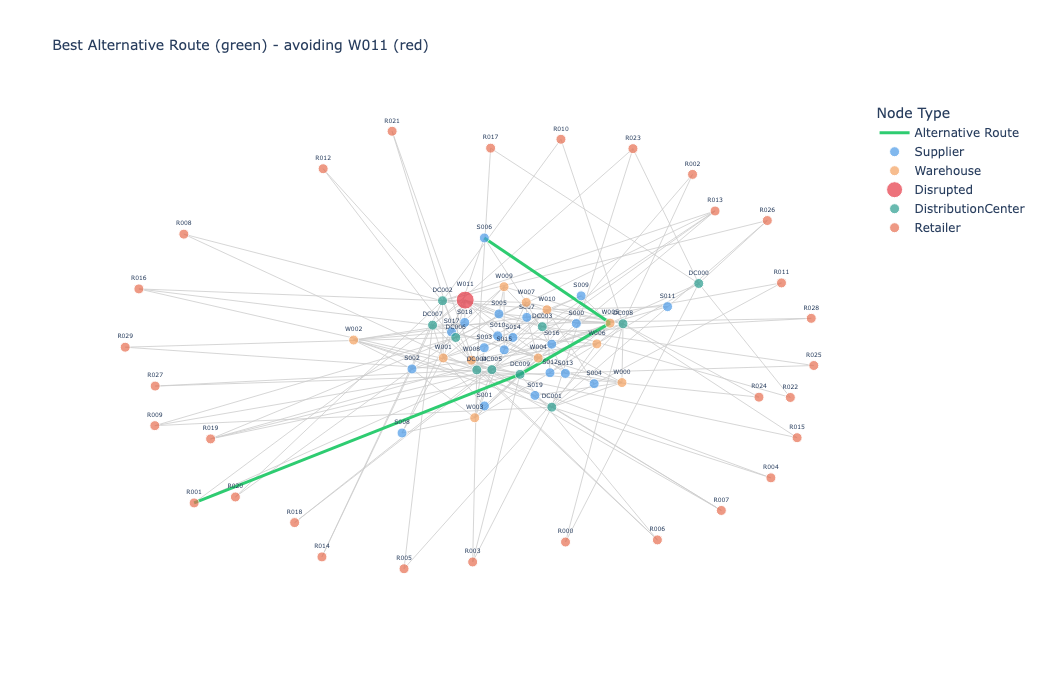
Figure 3. Best Alternative Route After Disruption
Figure 4 compares the top alternative routes by total shipping cost and number of hops. A route with more hops may still be cheaper - the cost comparison makes that trade-off explicit and gives logistics planners a clear basis for decision-making.
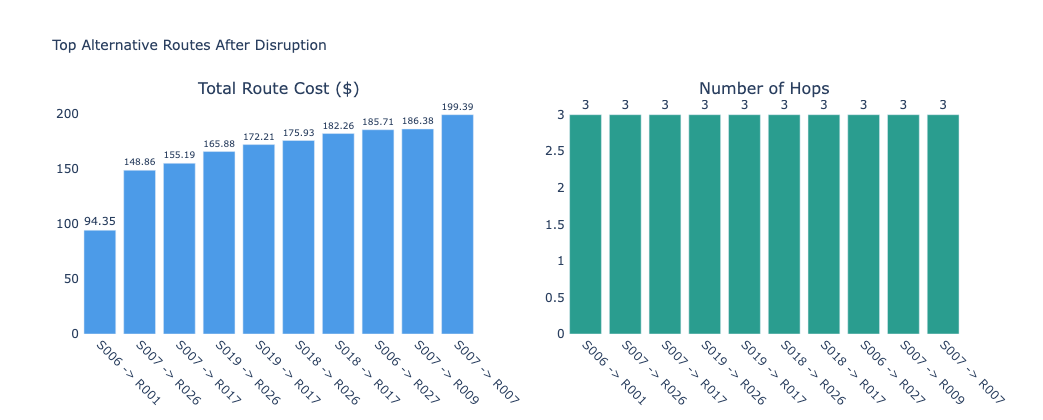
Figure 4. Alternative Route Cost and Hop Comparison
Gotchas and Lessons Learned
This project required some debugging. Here are the issues worth knowing about before you try this yourself.
Java Version Compatibility
PySpark 3.5.x officially supports several versions of Java. However, Java 23 removed javax.security.auth.Subject.getSubject(), which Spark's Hadoop dependency calls during startup. On Java 23 or later, this produces a cryptic UnsupportedOperationException: getSubject is not supported error and Spark never starts.
The solution is to install Java 21 LTS alongside any existing Java installation and point PySpark at it before starting Jupyter. Here, for example, using Homebrew on Apple hardware:
brew install openjdk@21
export JAVA_HOME=/opt/homebrew/opt/openjdk@21
export PATH="/opt/homebrew/opt/openjdk@21/bin:$PATH"
Any existing Java installation is unaffected outside that shell session. The Neo4j Spark Connector 6.x support for Spark 4.x is in active development, so upgrading PySpark to avoid the Java issue is a future option.
Relationship Write Deadlocks
When writing relationships via the Neo4j Spark Connector with multiple Spark partitions, concurrent writes can deadlock inside Neo4j as transactions compete for the same node locks. The error looks like this:
ForsetiClient can't acquire EXCLUSIVE NODE_RELATIONSHIP_GROUP_DELETE
because it would form a deadlock wait cycle
The solution is to call .coalesce(1) on the DataFrame before writing relationships, which forces Spark to write them sequentially from a single partition:
sdf.coalesce(1).write.format("org.neo4j.spark.DataSource") ...Node writes do not need this because they do not acquire the same lock types.
Stale Data Between Runs
In the Jupyter notebook's write configuration, the Spark Connector's Overwrite mode merges on node keys but does not remove relationships that existed in a previous run but are absent from the current one. If the dataset size changes between runs, old relationships accumulate alongside new ones, interfering with the graph structure.
The solution is to clear the database at the start of every load run rather than relying on Overwrite to clean up after itself. Always confirm the clear succeeded with a node count check before writing.
The none() Predicate and Missing Properties
This was the subtlest issue of the project. Our disruption query used:
WHERE none(n IN nodes(path) WHERE n.disrupted = true)This returned zero results even when paths clearly existed, and the disrupted node was correctly flagged. In Neo4j, when a node doesn't have a disrupted property at all, n.disrupted = true evaluates to null rather than false. The none() predicate then treats every node as potentially disrupted and filters out all paths. This is exactly how Cypher's three-valued logic works.
The solution is an explicit IS NOT NULL check:
WHERE none(n IN nodes(path) WHERE n.disrupted IS NOT NULL AND n.disrupted = true)shortestPath() and Alternative Routes
Initially, Neo4j's shortestPath() function was used to find alternative routes. It returned zero results. The reason is that shortestPath() finds the path with fewest hops first, then applies the WHERE none(...) filter. It computes a single shortest path rather than exploring alternative candidates, and filtering on disrupted nodes can eliminate that path without considering longer valid alternatives.
The solution is to use a plain variable-length path match with an explicit hop limit instead. This lets the WHERE clause filter while still returning valid results:
MATCH path = (s)-[:SHIPS_TO*..6]->(r)
WHERE none(n IN nodes(path) WHERE ...)
Guaranteed Connectivity in Generated Data
With purely random route generation, it's possible for a single node to end up as the only connection between two layers - a so-called sole bridge. Disrupting that node severs the network completely and leaves no alternative routes to find.
The solution is to generate routes with a guaranteed minimum connectivity. So, every source node gets at least two outbound routes, and every target node gets at least two inbound routes before random fill:
def make_routes(sources, targets, n_routes, min_out=2, min_in=2):
    # Guarantee every source has at least min_out outbound routes
    for s in src_ids:
        sample = rng.choice(tgt_ids, size = min(min_out, len(tgt_ids)), replace = False)
        for t in sample:
            if (s, t) not in seen:
                rows.append(make_row(s, t))

    # Guarantee every target has at least min_in inbound routes
    for t in tgt_ids:
        sample = rng.choice(src_ids, size = min(min_in, len(src_ids)), replace = False)
        for s in sample:
            if (s, t) not in seen:
                rows.append(make_row(s, t))

    # Fill remaining routes randomly
    ...
Cypher 25 Syntax
If you are running Neo4j 2025.06 or later, the CALL { WITH n ... } subquery syntax used in batch deletes is deprecated. Use the new variable scope syntax instead:
MATCH (n)
CALL (n) { DETACH DELETE n }
IN TRANSACTIONS OF 10000 ROWS
Summary
We've built a supply chain resilience analysis pipeline that models a supply chain as a graph, identifies its most critical nodes using betweenness centrality, simulates a real-world disruption, and finds alternative routes using native Cypher. Each tool did what it does best: Spark handled bulk data loading, Neo4j stored the graph and answered path queries, NetworkX computed the graph algorithm, and Plotly produced interactive visualizations at every stage.
The gotchas section above contains several useful engineering lessons, which should save you time and effort on your projects.
The full source code is available on GitHub.
Opinions expressed by DZone contributors are their own.
Comments