Toward Explainable AI (Part 8): Bridging Theory and Practice—SHAP: Powerful, But Can We Trust It?
Explainable AI bridges the gap between complex models and real-world accountability, helping teams build trust, ensure compliance, and make smarter decisions.
Join the DZone community and get the full member experience.
Join For FreeSeries reminder: This series explores how explainability in AI helps build trust, ensure accountability, and align with real-world needs, from foundational principles to practical use cases.
Previously, in Part VII: SHAP: Bringing Clarity to Financial Decision-Making.
In this Part: We move to the finance sector with a new use case: using SHAP values to interpret credit approval decisions made by a gradient boosting model.
Understanding Model Decisions With SHAP
Although effective, our model remains difficult to interpret, especially when it comes to understanding why it grants or denies credit. To provide greater transparency, we apply the SHAP method, which assigns each variable a numerical contribution to the prediction.
SHAP values offer several advantages. They allow us to identify the variables that play a key role in the model’s decision and to understand the direction of their influence, that is, whether they increase or decrease the likelihood of receiving credit. They also serve as a valuable tool for detecting potential biases or unexpected effects by revealing model behaviors that may not align with business expectations or regulatory standards.
SHAP values offer several advantages. They allow us to identify the variables that play a key role in the model’s decision and to understand how they influence the outcome, either by increasing or decreasing the likelihood of receiving credit. They also serve as a valuable tool for detecting potential biases or unexpected effects by revealing model behaviors that may not align with business expectations or regulatory standards.
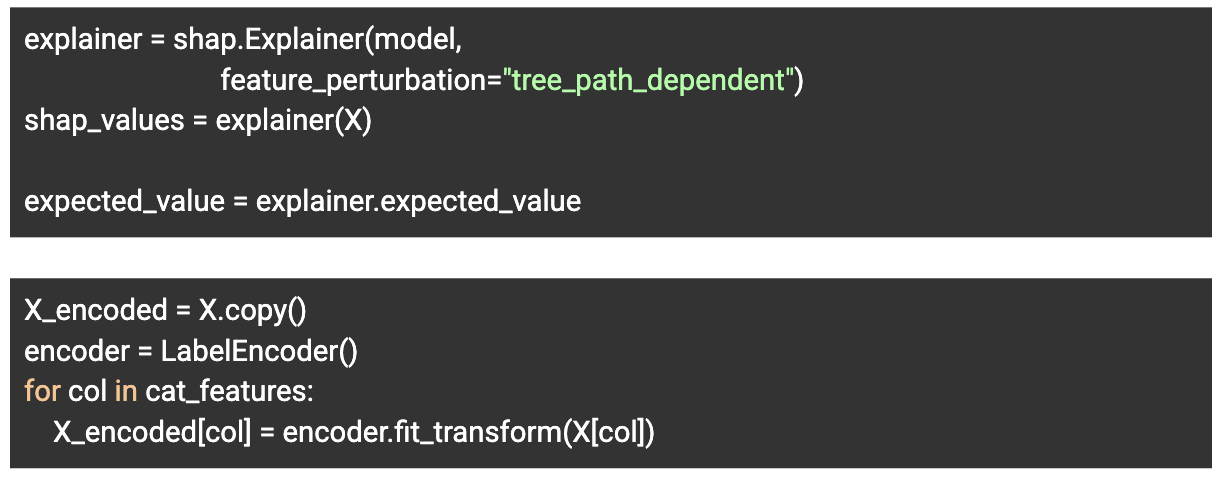
First, we begin by instantiating an explainer suited to our CatBoost model.
We now explore the various tools and visualizations offered by SHAP, along with how to interpret them.
The SHAP summary chart provides a global overview of variable importance in the model’s predictions. Variables are ranked based on their average influence, making it easy to quickly identify those that have the greatest impact on decisions.
In this chart, each point represents one observation from the dataset:
- Its position on the horizontal axis indicates the variable’s impact, whether positive or negative, on the prediction.
- Its color reflects the value taken by the variable, from lowest to highest.
This type of visualization is particularly useful for:
- Identifying the most influential variables in the model’s decisions.
- Understanding the direction of their influence, meaning whether they increase or decrease the likelihood that an application will be considered a good credit risk.

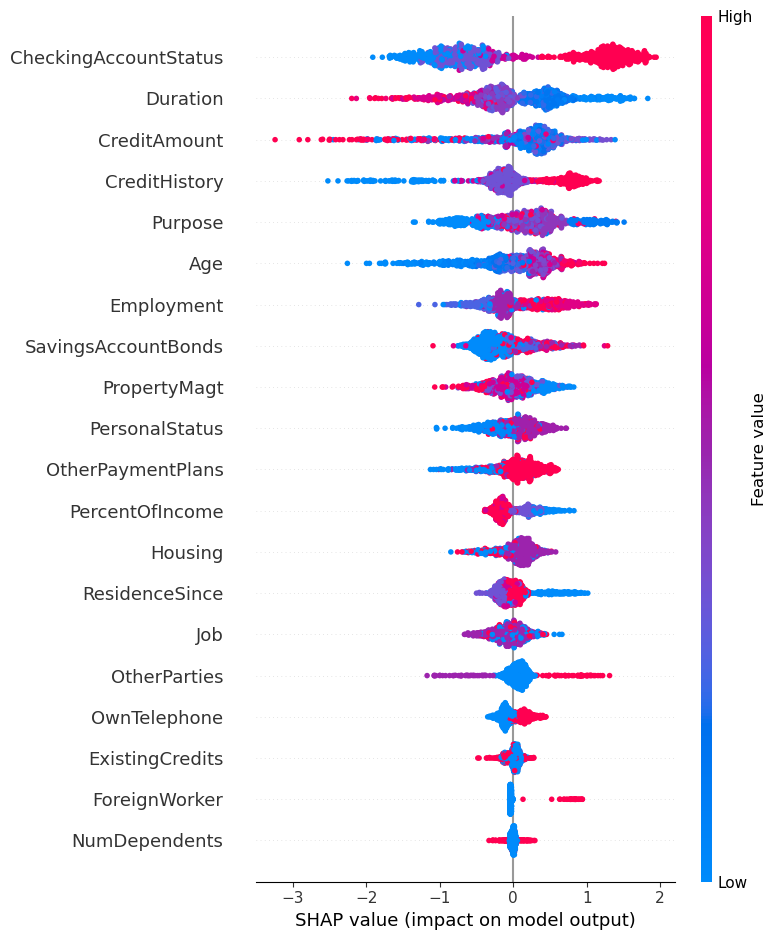
Summary plot SHAP
In our study, we generated several charts from subsamples, notably to analyze:
-
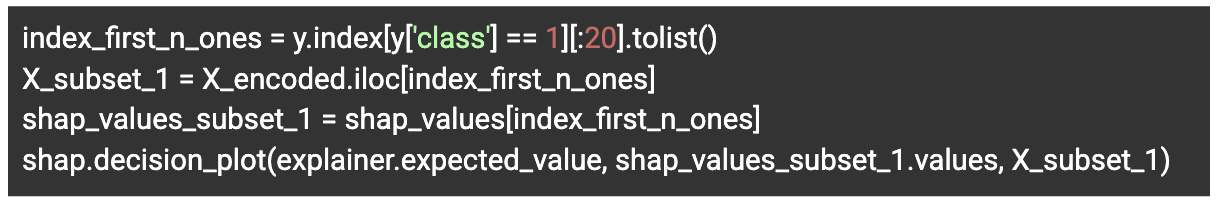
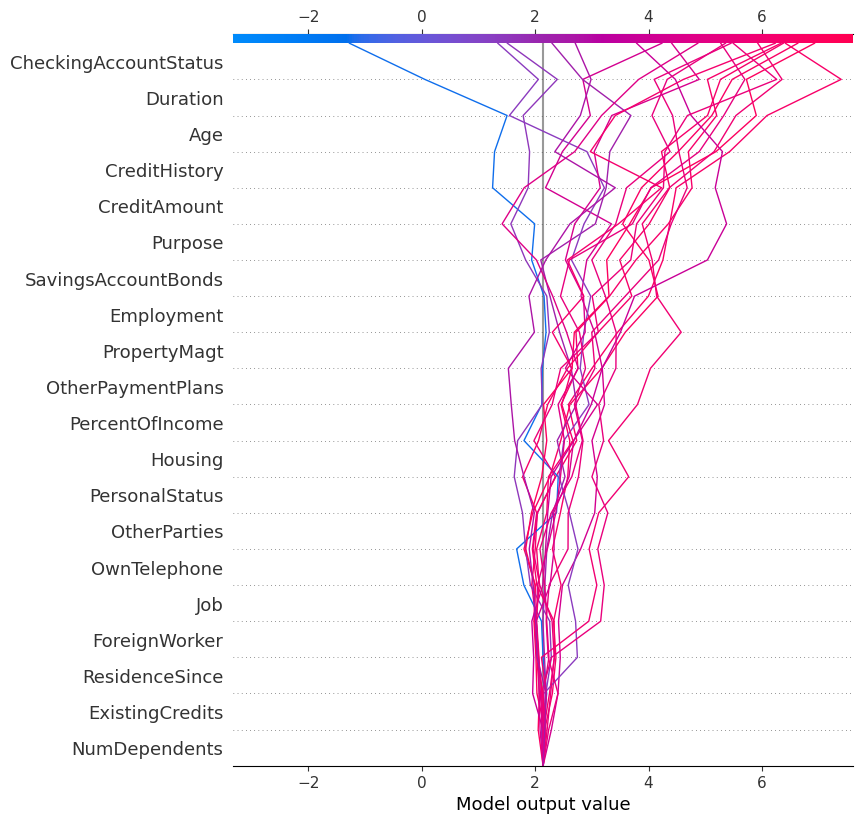
The first 20 predictions of the test set
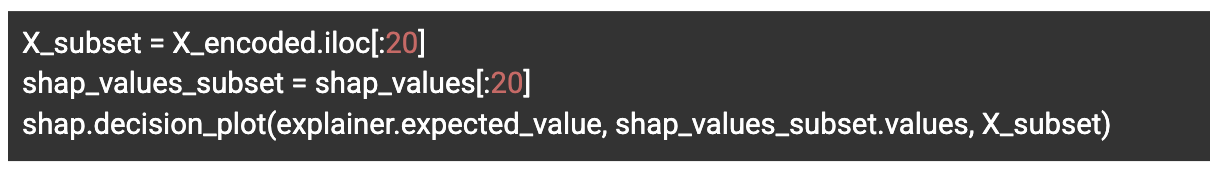
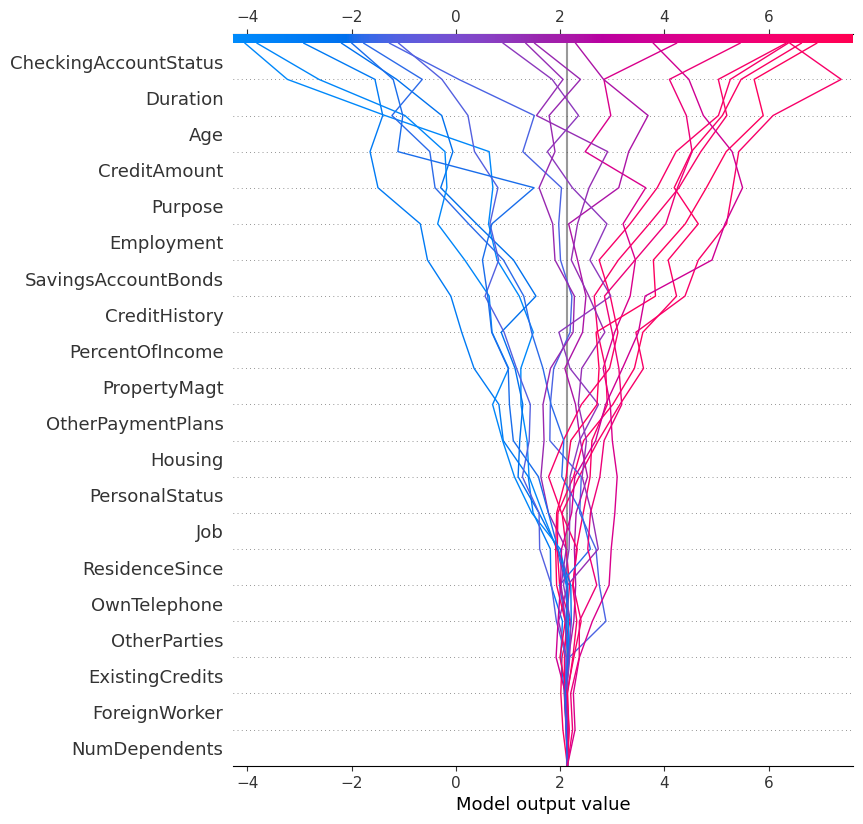
Decision chart for the first 20 predictions
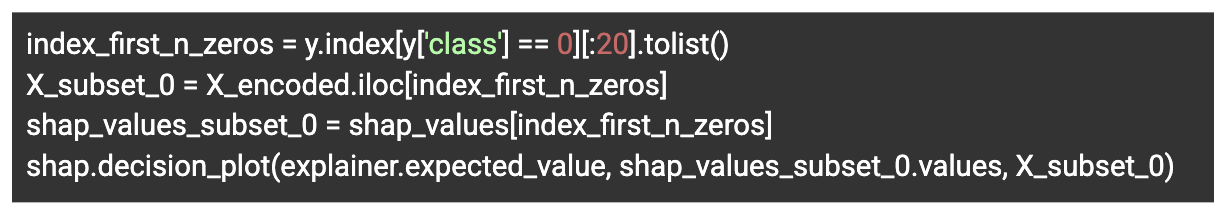
- The first 20 accepted predictions of the test set
![]()
Decision chart for the first 20 accepted credit predictions
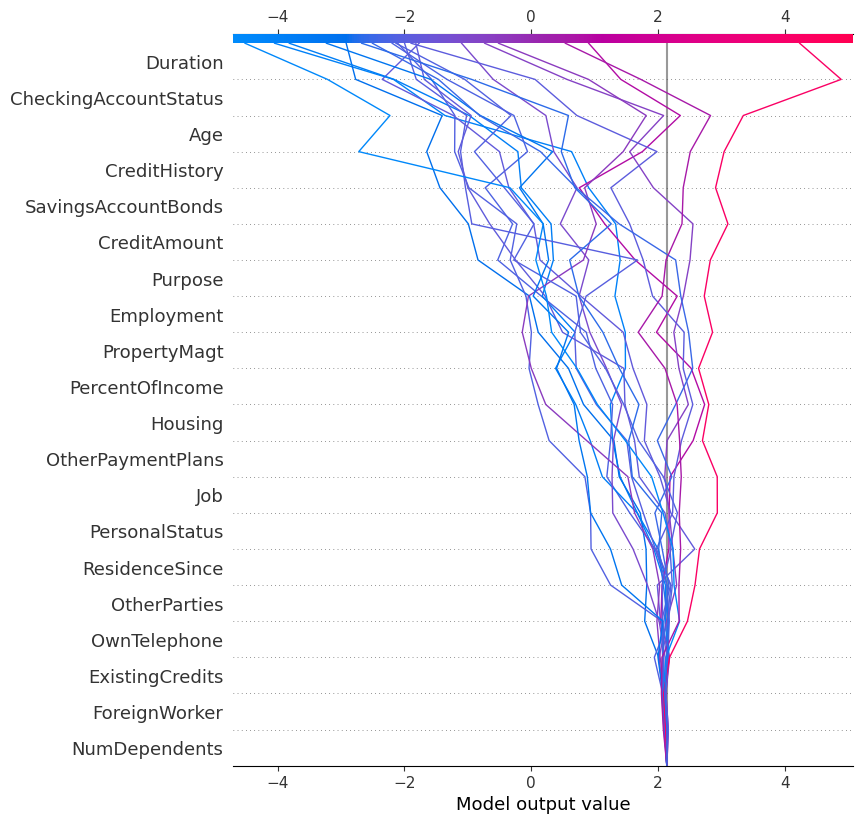
This approach offers several advantages. First, it allows for easy comparison of multiple predictions, providing a global view of the model’s behavior across different individuals. It also facilitates the detection of recurring patterns in decisions by highlighting variables that consistently influence certain predictions. Finally, it helps better understand the distinguishing factors that separate accepted credit from rejected credit.
This type of visualization is especially valuable in a business context because it enables examination of each decision individually while maintaining a comparative perspective across all cases studied.
We now move on to another aspect: individual prediction analysis, using two visualizations offered by SHAP: the Waterfall Chart and the individual Force Chart.
These two tools aim to explain in detail the prediction made for a single individual, showing feature by feature how each one contributes positively or negatively to the model’s final decision.
The Waterfall chart offers a static and step-by-step representation, where the effect of each variable on the prediction is visualized progressively. It starts from the base value (that is, the model’s average prediction over the entire dataset) and successively adds or subtracts the impact of each variable until reaching the final prediction value.
The individual Force chart, on the other hand, offers a more interactive and intuitive visualization, where each variable is represented by a force pulling the prediction either toward a probability of approved credit or toward a probability of denial. This representation allows for immediate understanding of which variables pushed the decision in one direction or the other.
These visualizations are especially useful for exploring specific cases in detail and for communicating transparently with non-technical stakeholders. They make the reasons behind the model’s decision for a given individual easier to understand.
In our study, we analyzed the prediction of a randomly selected client whose credit was approved.

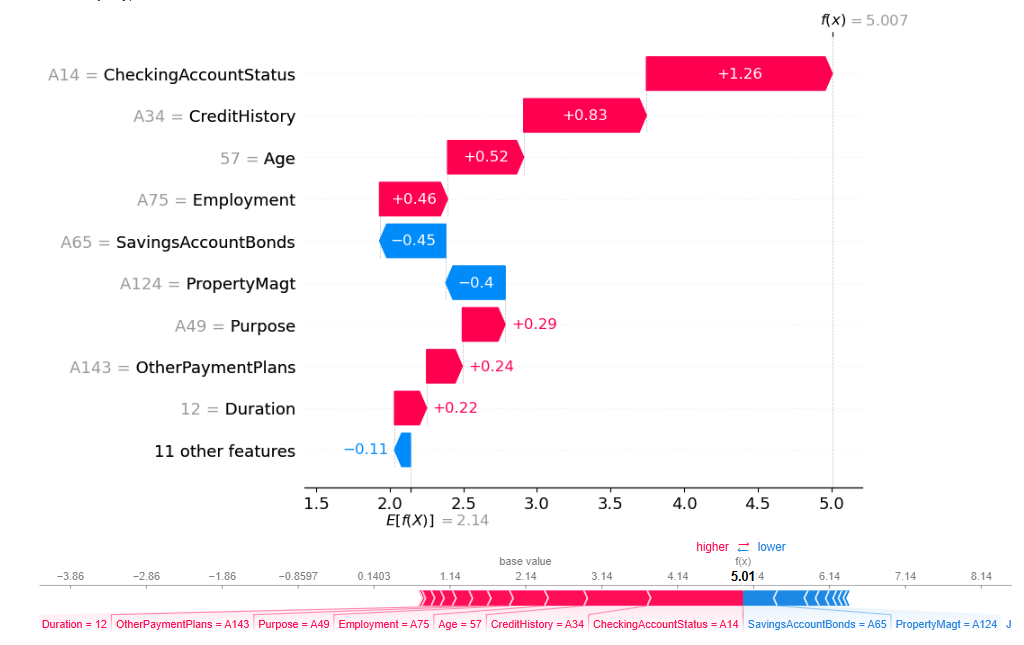
Waterfall chart and Force chart for a randomly selected client whose credit was approved
We then did the same for a randomly selected client whose credit was denied.
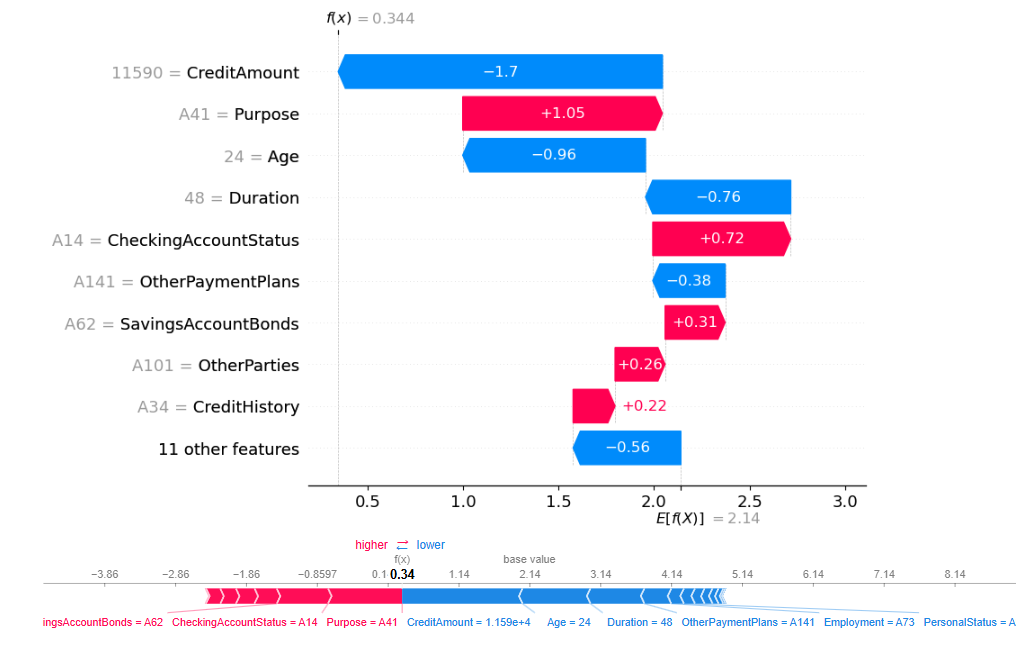
Waterfall chart and Force chart for a randomly selected client whose credit was denied
Key Findings and Limitations
All these visualizations help us better understand the influence of the most important variables in each individual decision. This information is valuable because it provides the ability to justify the model’s predictions and compare them with business knowledge, which helps build user trust.
These explanations can also be used in an operational context, for example, to develop more precise sales messaging or to explain to a client the discriminating criteria that worked against them in the case of a credit denial. Thus, explainability is not limited to a simple technical audit tool but becomes a true lever for communication and transparency in client relations.
It is essential to remember that, beyond the model’s predictive performance, evaluating the quality and reliability of explainability methods is a crucial step. In our use case, this evaluation is easier than in the previous example related to medical imaging because we work with structured numerical data, which is often more intuitive for business experts to interpret.
Several approaches can be explored to assess the robustness and relevance of explanations generated by SHAP. On one hand, we conducted a stability analysis by introducing slight perturbations in our data through adding Gaussian noise to numerical variables. This approach helps verify that small variations in input data do not produce major or inconsistent changes in SHAP values, ensuring the robustness of the explanations.
On the other hand, we used the SHAP Dependence Chart to detect potential biases in the model by examining the specific influence of certain variables, such as CheckingAccountStatus. This type of visualization highlights possible problematic relationships or disproportionate effects that could unfairly steer the model’s decisions.
Finally, we compared SHAP results with CatBoost’s internal variable importance methods. This approach aims to validate the consistency of the analyses by confronting two different perspectives: the model’s internal view and the external view provided by an independent explainability method. This comparison helps build trust in the explanations and identify any discrepancies that may require further investigation.
It is important to remember that, to date, no universal method exists to evaluate explainability. Each user must adapt their tools and evaluation criteria according to their context, data, and business stakes. Moreover, it is often wise to combine several explainability methods, such as SHAP and LIME, to obtain a more comprehensive and robust understanding of the model’s behavior.
In conclusion, using SHAP in our use case allowed us to transform a high-performing but opaque model into a much more transparent and understandable tool. Thanks to its global and local visualizations, SHAP provides detailed explanations that facilitate understanding of the model’s decision-making mechanisms, while helping strengthen trust among business users. In a sensitive field like credit risk assessment, this ability to explain, justify, and audit algorithmic decisions is a major asset for ensuring responsible and ethical artificial intelligence.
Wrap-up and what’s next: SHAP offers powerful insights into individual and global model behaviors, but can we trust them? Next, in part IX, we’ll look at the method’s hidden risks and caveats.
Links to the previous articles published in this series:
- Toward Explainable AI (Part I): Bridging Theory and Practice—Why AI Needs to Be Explainable
- Toward Explainable AI (Part 2): Bridging Theory and Practice—The Two Major Categories of Explainable AI Techniques
- Toward Explainable AI (Part 3): Bridging Theory and Practice—When Explaining AI Is No Longer a Choice
- Toward Explainable AI (Part 4): Bridging Theory and Practice—Beyond Explainability, What Else Is Needed
- Toward Explainable AI (Part 5): Bridging Theory and Practice—A Hands-On Introduction to LIME
- Toward Explainable AI (Part 6): Bridging Theory and Practice—What LIME Shows – and What It Leaves Out
- Toward Explainable AI (Part 7): Bridging Theory and Practice—SHAP: Bringing Clarity to Financial Decision-Making
Glossary
Algorithmic Bias: Systematic and unfair discrimination in AI outcomes caused by prejudices embedded in training data, model design, or deployment processes, which can lead to disparate impacts on certain population groups. Detecting and mitigating algorithmic bias is a key objective of explainable AI.
Bias Detection (via XAI): Use of explainability methods to identify biases or disproportionate effects in algorithmic decisions.
Contrastive and Counterfactual Explanations: Explanations that compare the decision made to what could have happened by changing certain variables (e.g., “Why this outcome instead of another?”).
Decision Plot: A graphical representation tracing the successive impact of variables on an individual prediction.
Evaluation Metrics for Explainability: Criteria used to assess the quality of an explanation (fidelity, robustness, consistency, etc.).
Feature Importance (Variable Contribution): Measurement or attribution of the relative impact of each variable on the model’s final decision.
Force Chart (Force Plot): An interactive visualization illustrating positive or negative forces exerted by each variable on a prediction.
Fidelity: A measure of how faithfully the explanation reflects the true logic of the model.
Global Explanation: An overview of the model’s behavior across the entire dataset.
Human Interpretability: The quality of an explanation to be understood and useful to a human, non-expert user.
Intrinsically Interpretable Models: Models whose very structure allows direct understanding (e.g., decision trees, linear regressions).
LIME (Local Interpretable Model-agnostic Explanations): A local explanation method that generates simple approximations around a given prediction to reveal the influential factors.
Local Explanation: A detailed explanation regarding a single prediction or individual case.
Model Transparency: The quality of a model in making its decision-making processes accessible and understandable.
Post-hoc Explainability: Explainability techniques applied after model training, without altering its internal functioning.
Robustness (Stability): The ability of an explainability method to provide consistent explanations despite small variations in input data.
SHAP (SHapley Additive exPlanations): An approach based on game theory that assigns each variable a quantitative contribution to the prediction, providing both global and local explanations.
Summary Chart (Summary Plot): A visualization ranking variables according to their average influence on predictions.
Waterfall Chart: A static visualization showing step by step how each variable contributes to the final prediction.
Links
1. LIME: [link]
2. Chest X-Ray Images (Pneumonia): [link]
3. German Credit Dataset: [link]
4. Complete notebook for the LIME case study: [link]
5. Complete notebook for the SHAP case study: [link]
6. Leslie, D., Rincón, C., Briggs, M., Perini, A., Jayadeva, S., Borda, A., et al. (2024). AI Explainability in Practice, The Alan Turing Institute, AI Ethics and Governance in Practice Programme. Participant & Facilitator Workbook: [link]
7. What is AI (Artificial Intelligence)? McKinsey & Company, avril 2024: [link]
8. Jennifer Kite-Powell. Explainable AI Is Trending And Here’s Why. Forbes, 2022. Disponible sur: [link]
9. European Commission. Excellence and Trust in AI, European Commission, 2020: [link]
10. Melissa Heikkilä (2024). Nobody really knows how AI works — and that’s a problem. MIT Technology Review: [link]
11. Heaven, W. D. (2023). Large language models can do jaw-dropping things. But nobody knows exactly why. MIT Technology Review: [link]
12. Forbes - Jameel Francis, “Why 85% of Your AI Models May Fail”, Forbes, 15 Nov. 2024 [link]
13. A. Bao & Y. Zeng, “Understanding the dilemma of explainable artificial intelligence”, Nature - Humanities and Social Sciences Communication (2024): [link]
14. C. Gallese, The AI Act proposal: a new right to technical interpretability?, arXiv preprint, arXiv:2303.17558 [cs.CY], 2023: [link]
15. European Data Protection Board. (2024). Checklist for AI Auditing Scores – EDPB Support Pool of Experts Programme. June 2024: [link]
16. White, B., & Guha, K. (2025). Component-Based Quantum Machine Learning Explainability. arXiv preprint arXiv:2506.12378: [link]
Opinions expressed by DZone contributors are their own.
Comments