Using Ingest Pipelines to Enhance Elastic Observability Data
This article explores how to put ingest pipelines to real use: by enhancing observability data on the Elastic stack.
Join the DZone community and get the full member experience.
Join For FreeIn a previous article, I had written about distributed tracing and how it can be implemented easily on the Elastic stack. I have used many observability platforms, including NewRelic, Splunk, and DataDog. All of them are very powerful platforms and have everything you would need for implementing full-stack observability for your applications.
Elastic is generally used for fast and powerful content search and log aggregation and analysis, but it has gained popularity recently for full-stack observability as well. It has pretty much every feature you would want in an observability platform, including support for applications written on a modern tech stack, support for tracing/logging/metrics, powerful out-of-the-box agents, visualizations and dashboards, alerting, AI-based anomaly detection, and so on.
The key advantages of Elastic observability, in my opinion, are:
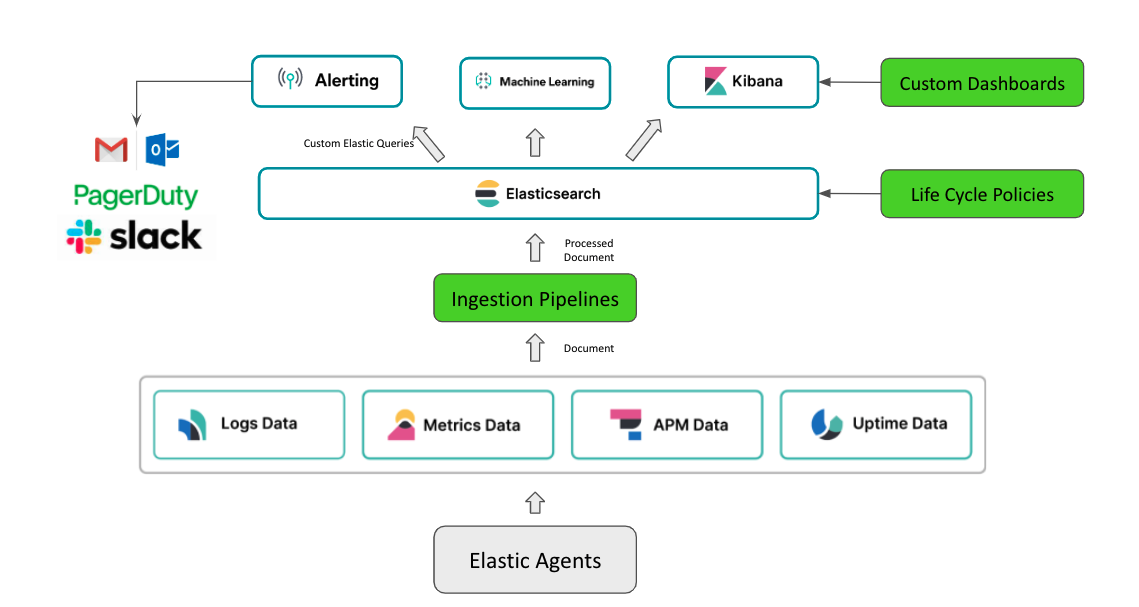
- It is powered by Elasticsearch. All observability data (logs, traces, metrics, uptime health, and so on) are processed, indexed, and stored as Elasticsearch documents, which gives flexibility to:
- Apply ingest pipelines to process, enrich, and transform observability data before indexing.
- Use index lifecycle policies to control observability data storage size and thereby costs.
- Set alerts using custom Elastic queries which makes alerting very flexible and not limited to standard alerts on error counts, logs counts, error rates, latency thresholds, and so on.
- The user interface is Kibana, which is a powerful and flexible UI tool that provides the ability to build custom dashboards on top of indexed documents.
In this article, we will focus on ingest pipelines.
Ingest Pipelines
Ingest pipelines are pre-indexing hooks provided by Elastic to perform transformations on your incoming documents. Once you create a pipeline and set it up for incoming documents, every document would go through the pipeline. Some examples of transformations include:
- convert: change datatype of a field; for example: string to integer, string to Boolean
- CSV: extract comma-separated data from a field and create an array field
- Drop: drop the whole document from indexing (on certain conditions)
- Grok: extract structured fields out of a text file by applying grok patterns
- GeoIp: add geographic information such as city, country, continent, or latitude/longitude for a given IP address
- Enrich: enrich your document with extra info from another index
For the full list of processors that can be used in ingest pipelines, refer to the Elastic processor reference.
Ingest Pipeline for Apdex Score
Let's put ingest pipelines to some real use. We will create an ingest pipeline to enhance distributed trace data by calculating and adding an Apdex score for all transactions.
Pipelines can be created from the Kibana UI or through an API call.
Creating from Kibana UI
Step 1: Create Apdex Score Pipeline
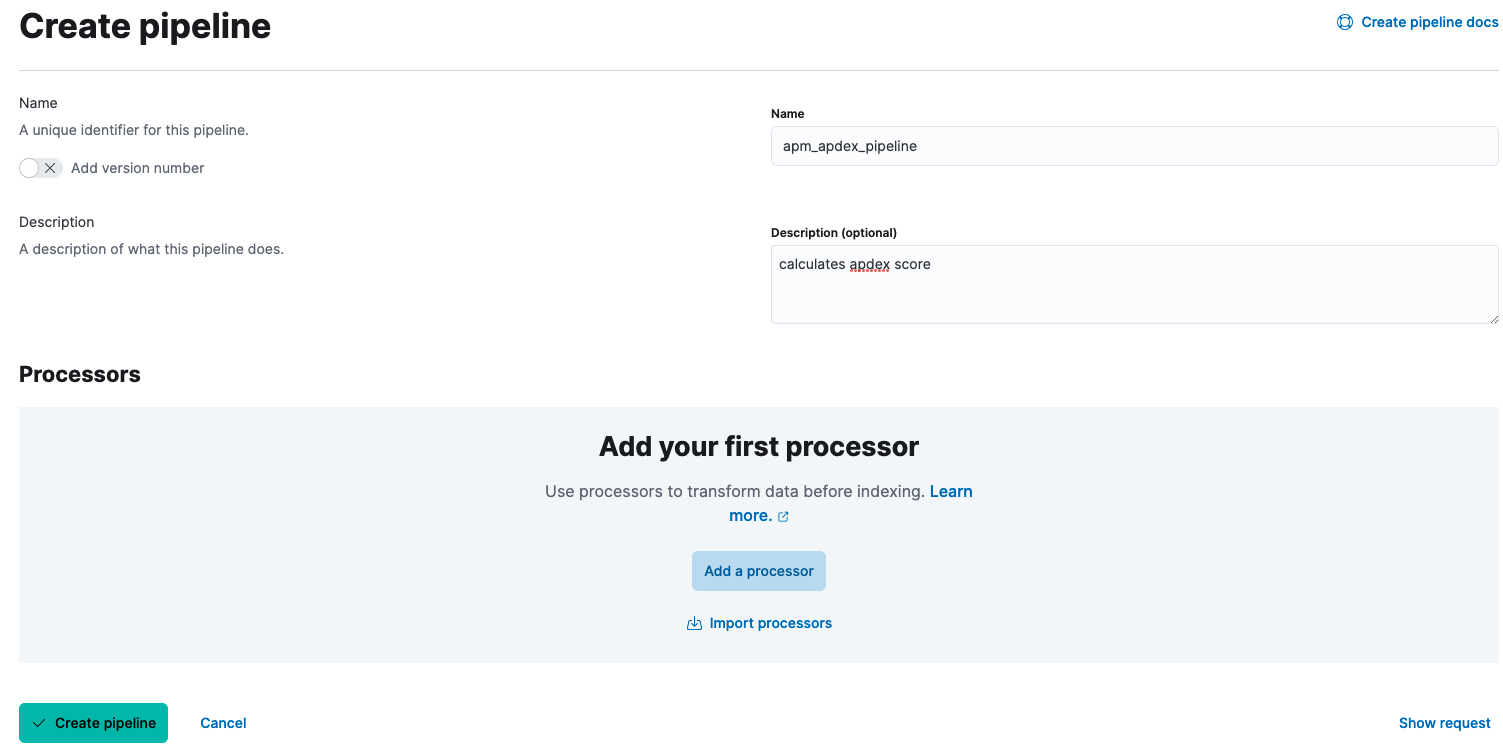
1. Go to the menu on top left --> Stack Management --> Ingest Pipelines. Click on the 'Create Pipeline' button on the top right of the page.
2. Give a name and an optional description for the pipeline.
3. Add a processor to convert transaction.duration.us into a Double and set it to a field. transaction.duration.us is the field that has the time taken by the request in microseconds.

4. Add a script processor to calculate the Apdex score and add the following script:
//acceptable latency in ms. edit as per your needs
int transaction_threshold=2000;

double final_apdex_score=1.0;
double transaction_duration_in_millis = ctx.apdex_score_test / 1000; //convert to ms

//logic: requests with latency less than threshold are satisfying requests,
//requests taking less than 4x of threshold are tolerable
//requests taking more than 4x are unacceptable
if ( transaction_duration_in_millis < transaction_threshold ) {
    final_apdex_score = 1.0;
} else if ( transaction_duration_in_millis > transaction_threshold ) {
    if ( transaction_duration_in_millis <= 4 * transaction_threshold ) {
        final_apdex_score = 0.5;
    } else {
        final_apdex_score = 0.0;
    }
}
ctx.apdex_score_test = final_apdex_score;
5. Create pipeline.
Step 2: Edit the Default APM Pipeline
Elastic has a default APM pipeline that it applies to all APM data. It is only possible to have one pipeline per index. To make Elastic process the documents through both the default pipeline and our custom pipeline, we will edit the default pipeline to include the custom pipeline.
1. Go to the menu on top left --> Stack Management --> Ingest Pipelines. Search for apm. Edit the "apm" pipeline.
2. Add a Processor of type "Pipeline". Specify the pipeline name as apm_apdex_pipeline (the name of the pipeline we created above) and condition as ctx.processor?.event='transaction' (we want this pipeline only for transactions and not spans).
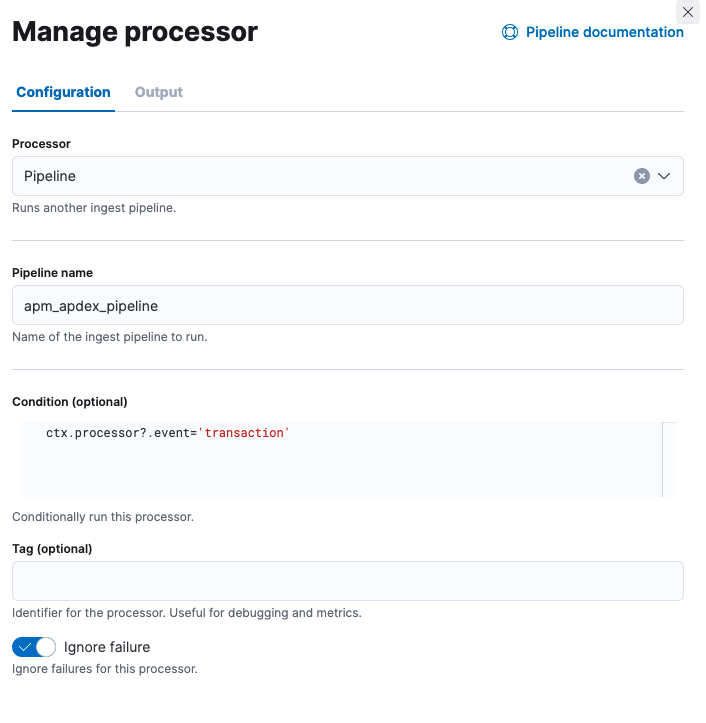
4. Save the processor, ensure it is the last step in the pipeline, and Save Pipeline. (You can test the pipeline before saving it, as explained below.)
Creating through APIs
If you prefer doing all these through API calls, here are the requests to create the Apdex score pipeline and update the APM pipeline. These requests can be executed from the API console under Dev Tools in Kibana.
Create Apdex Pipeline
PUT _ingest/pipeline/apm_apdex_pipeline
{
  "description": "calculates apdex score",
  "processors": [
    {
      "convert": {
        "field": "transaction.duration.us",
        "type": "double",
        "target_field": "apdex_score_test",
        "ignore_missing": true,
        "ignore_failure": true
      }
    },
    {
      "script": {
        "source": "int transaction_threshold=2000;\ndouble final_apdex_score=1.0;\ndouble transaction_duration_in_millis = ctx.apdex_score_test / 1000;\nif ( transaction_duration_in_millis < transaction_threshold ) {     \n    final_apdex_score = 1.0; \n} else if ( transaction_duration_in_millis > transaction_threshold ) {    \n    if ( transaction_duration_in_millis <= 4 * transaction_threshold ) {      \n        final_apdex_score = 0.5;     \n    } else {      \n        final_apdex_score = 0.0;     \n    }  \n}\nctx.apdex_score_test = final_apdex_score;",
        "ignore_failure": true
      }
    }
  ]
}
Update APM Pipeline
PUT _ingest/pipeline/apm
{
  "description": "Default enrichment for APM events",
  "processors": [
    {
      "pipeline": {
        "name": "apm_ingest_timestamp"
      }
    },
    {
      "pipeline": {
        "name": "apm_user_agent"
      }
    },
    {
      "pipeline": {
        "name": "apm_user_geo"
      }
    },
    {
      "pipeline": {
        "name": "apm_remove_span_metadata"
      }
    },
    {
      "pipeline": {
        "name": "apm_error_grouping_name",
        "if": "ctx.processor?.event == 'error'"
      }
    },
    {
      "pipeline": {
        "name": "apm_metrics_dynamic_template",
        "if": "ctx.processor?.event == 'metric'"
      }
    },
    {
      "pipeline": {
        "name": "apm_apdex_pipeline",
        "if": "ctx.processor?.event == 'transaction'",
        "ignore_failure": true
      }
    }
  ]
}
Testing Ingest Pipelines
The APM ingest pipeline now calculates and sets an Apdex score for all transactions. To test this:
- Open the APM pipeline and click on Add Documents --> Add a test document from an Index.
- Provide the index and document to be tested and add the document in. Our pipeline is set to work on APM documents of type transaction. The index would be
apm-<version>-transaction-<sequencenumber>. For example:apm-7.17.2-transaction-000002. You can find the ID and index name in the Discover tab. - Alternatively, a document can be manually copied into the Documents field.
- Once a document is added, click on Output tab. The resulting document should have a field called
apdex_score_testwith value 1 or 0 or 0.5.
Apdex Score per Service
The ingest pipeline is now set up to calculate the Apdex score per request. For each request, a score is calculated and set (1 for a satisfying request, 0.5 for a tolerable request, and 0 for a really slow request). To find the score for a specific service, all we need to do now is average the score of all requests in that service. You can set Elastic Alerts on Index Threshold for your service when the average Apdex score falls below a certain value. For instance, you can set up warning for anything less that 0.85 and critical alert for anything less than 0.75.
Other Use Cases for Ingest Pipelines
Ingest pipelines are powerful tools that can help improve your observability data. With the abundance of processor options, there is no limit to what can be achieved. Here are some additional use cases:
Add Geographical Information for All Transactions
Every incoming request has a client IP associated with it. The GeoIp processor can be used to enhance this data with continent name, country name, country ISO code, city name, latitude/longitude, and so on.
Add Team Name/Contact to Transaction Errors for Support
The Enrich processor provides a way to look up data from another index. For this use case, we can load an index with one document per service. Each document should have the service name, team name, and contact details. Enrich processor can then be used to look up this index on the service.name field in APM to fill the team and contact details for every failed transaction. This can be used by your first-level support team to reach out to the right team for additional help.
Removing Extra Fields for Saving Storage
Elastic documents contain lot of information, and your storage costs may shoot up as more documents get indexed. Removing unused/unwanted fields would help in reducing document size and decluttering index views in Kibana. This can be done using the Remove processor.
Opinions expressed by DZone contributors are their own.
Comments