How to Enable Azure Databricks Lakehouse Monitoring Through Scripts
This guide uses Python scripts to enable Databricks Lakehouse Monitoring for snapshot profiles for all Delta Live Tables in a schema in the Azure environment.
Join the DZone community and get the full member experience.
Join For FreeDisclaimer: All the views and opinions expressed in the blog belong solely to the author and not necessarily to the author's employer or any other group or individual. This article is not a promotion for any cloud/data management platform. All the images and APIs are publicly available on the Azure/Databricks website.
What Is Databricks Lakehouse Monitoring?
In my other articles, I have described what Databricks and Unity Catalog are, and how to create a catalog from scratch using a script. In this article, I will describe the Lakehouse Monitoring feature available as part of the Databricks platform and how to enable the feature using scripts.
Lakehouse Monitoring provides data profiling and data quality-related metrics for the Delta Live Tables in Lakehouse. Databricks Lakehouse Monitoring provides a comprehensive insight into the data such as changes in data volume, numerical distribution changes, % of null and zeroes in the columns, and detection of categorical anomalies over time.
Why Use Lakehouse Monitoring?
Monitoring your data and ML model performance provides quantitative measures that help you track and confirm the quality and consistency of your data and model performance over time.
Here’s a breakdown of the key features:
- Data quality and data integrity tracking: Tracks the flow of data across pipelines, ensuring data integrity and providing visibility into how the data has changed over time, 90th percentile of a numerical column, % of null and zero columns, etc.
- Data drifts over time: Provides metrics to detect data drift between the current data and a known baseline, or between successive time windows of the data
- Statistical distribution of data: Provides numerical distribution change of data over time that answers what the distribution of values in a categorical column is and how it differs from the past
- ML model performance and prediction drift: ML model inputs, predictions, and performance trends over time
How It Works
Databricks Lakehouse Monitoring provides the following types of analysis: time series, snapshot, and inference.
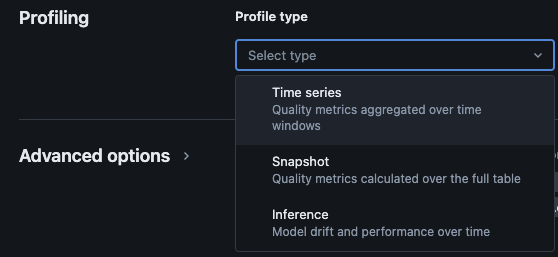
Profile types for monitoring
When you enable Lakehouse monitoring for a table in Unity Catalog, it creates two tables in the specified monitoring schema. You can query, and create dashboards (Databricks provides a default configurable dashboard out of the box) and notifications on the tables to get comprehensive statistical and profile information on your data over time.
- Drift metric table: The drift metrics table contains statistics related to the data’s drift over time. It captures information such as differences in the count, the difference in average, the difference in % null and zeros, etc.
- Profile metric table: The profile metrics table contains summary statistics for each column and for each combination of time window, slice, and grouping columns. For InferenceLog analysis, the analysis table also contains model accuracy metrics.
How to Enable Lakehouse Monitoring via Scripts
Prerequisites
- Unity Catalog, schema, and Delta Live Tables are present.
- The user is the owner of the Delta Live Table.
- For private Azure Databricks clusters, private connectivity from serverless compute is configured.
Step1: Create a Notebook and Install Databricks SDK
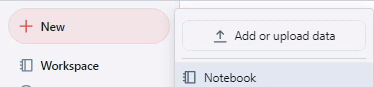
Create a notebook in the Databricks workspace. To create a notebook in your workspace, click the "+" New in the sidebar, and then choose Notebook.
A blank notebook opens in the workspace. Make sure Python is selected as the notebook language.
Copy and paste the code snippet below into the notebook cell and run the cell.
%pip install databricks-sdk --upgrade
dbutils.library.restartPython()
Step2: Create Variables
Copy and paste the code snippet below into the notebook cell and run the cell.
catalog_name = "catalog_name" #Replace the catalog name as per your environment.

schema_name = "schema_name" #Replace the schema name as per your environment.

monitoring_schema = "monitoring_schema" #Replace the monitoring schema name as per your preferred name.

refresh_schedule_cron = "0 0 0 * * ?" #Replace the cron expression for the refresh schedule as per your need.
Step3: Create Monitoring Schema
Copy and paste the code snippet below into the notebook cell and run the cell. This snippet will create the monitoring schema if it doesn't exist already.
%sql

USE CATALOG `${catalog_name}`;
CREATE SCHEMA IF NOT EXISTS `${monitoring_schema}`
Step 4: Create Monitor
Copy and paste the code snippet below into the notebook cell and run the cell. This snippet will create Lakehouse Monitoring for all the tables inside the schema.
import time
from databricks.sdk import WorkspaceClient
from databricks.sdk.errors import NotFound, ResourceDoesNotExist
from databricks.sdk.service.catalog import MonitorSnapshot, MonitorInfo, MonitorInfoStatus, MonitorRefreshInfoState, MonitorMetric, MonitorCronSchedule

databricks_url = 'https://adb-xxxx.azuredatabricks.net/' # replace the url with your workspace url
api_token = 'xxxx' # replace the token with your personal access token for the workspace. Best practice - store the token in Azure KV and retrieve the token using key-vault scope.

w = WorkspaceClient(host=databricks_url, token=api_token)

all_tables = list(w.tables.list(catalog_name=catalog_name, schema_name=schema_name))
for table in all_tables:
  table_name = table.full_name
  info = w.quality_monitors.create(
          table_name = table_name,
          assets_dir = "/Shared/databricks_lakehouse_monitoring/", # Creates monitoring dashboards in this location
          output_schema_name = f"{catalog_name}.{monitoring_schema}",
          snapshot = MonitorSnapshot(),
          schedule = MonitorCronSchedule(quartz_cron_expression = refresh_schedule_cron, timezone_id = "PST") # update timezone as per your need.
        )
  # Wait for monitor to be created
  while info.status ==  MonitorInfoStatus.MONITOR_STATUS_PENDING:
   info = w.quality_monitors.get(table_name=table_name)
   time.sleep(10)
  assert info.status == MonitorInfoStatus.MONITOR_STATUS_ACTIVE, "Error creating monitor"
Validation
After the script is executed successfully, you can navigate to catalog -> schema -> table and go to the "Quality" tab in the table to view the monitoring details.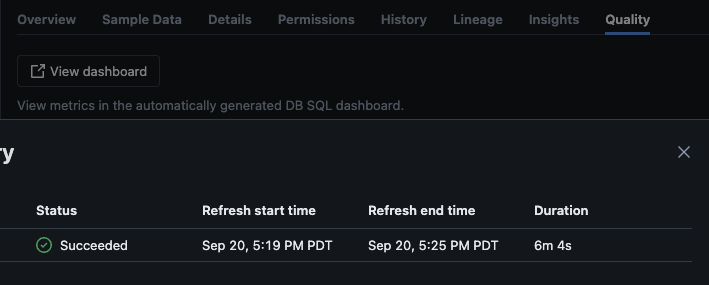
If you click on the "View dashboard" button on the upper left corner of the Monitoring page, the default monitoring dashboard will open. Initially, the data will be blank. As the monitoring runs on the schedule, over time it will populate all the statistical, profile, and data quality values.

You can also navigate to the "Data" tab in the dashboard. Databricks out of the box provides a list of queries to get the drift and other profile information. You can also create your own queries as per your need to get a comprehensive view of your data over time.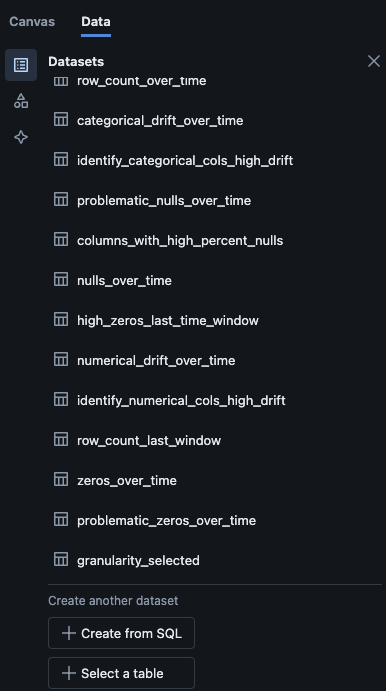
Conclusion
Databricks Lakehouse Monitoring offers a structured way to track data quality, profile metrics, and detect data drifts over time. By enabling this feature through scripts, teams can gain insights into data behavior and ensure the reliability of their data pipelines. The setup process described in this article provides a foundation for maintaining data integrity and supporting ongoing data analysis efforts.
Opinions expressed by DZone contributors are their own.
Comments