Primary Supervised Learning Algorithms Used in Machine Learning
In this article, we explain the most commonly used supervised learning algorithms, the types of problems they're used for, and provide some specific examples.
Join the DZone community and get the full member experience.
Join For FreeWhat Is Supervised Learning?
Supervised learning is a machine learning subset where a machine learning model is trained on labeled (inputs) data. As a result, the supervised model is capable of predicting further outcomes (outputs) as accurately as possible.
The concept behind supervised learning can be explained from real-life scenarios such as a teacher tutoring a child about a new topic for the first time.
For simplification, let's say that the teacher wants to teach the child to successfully identify the image of a cat and a dog. The teacher will start the tutoring process by continuously showing the child images of either a cat or a dog with the addition of having the teacher inform the child if the image is that of a dog or a cat.
The cat and dog images can be considered labeled data as the training process done by the child/machine learning model will be informed which data belongs to which category.
What is supervised learning used for? Supervised learning can be used for regression and classification problems. Classification models allow the algorithm to determine the group to which the given data belongs. Examples may include True/False, Dog/Cat, and so on.
While regression models are capable of predicting numerical values depending on previous data, examples may include predicting the salary of a given employee or the selling price of real estate property.
In this tutorial, we are going to list some of the most common algorithms that are used in supervised learning, along with a practical tutorial on such algorithms.
Note that these tutorials are coded in Python. All the used datasets are provided on Kaggle, thus, there will be no need to download any large datasets.
Linear Regressions
Linear regression is a supervised learning algorithm that predicts the output value depending on the given input values. Linear regression is used when the target (output) variable returns a continuous value.
There are two main types of linear algorithms, simple and multiple linear regressions.
Simple linear regression uses only one independent (input) variable. An example would be predicting the age of a child by his given height.
Multiple linear regression, on the other hand, can use multiple independent variables to predict its final result. An example would be predicting the real estate price of a given property depending on its location, size, demand, and so on.
The following is the linear regression formula
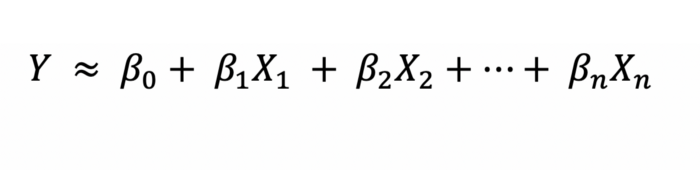
For our Python example, we will use linear regression to predict the y values with respect to the given x values.
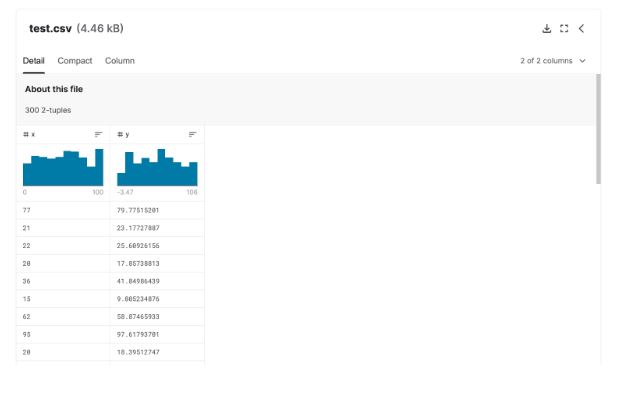
Our given dataset will include only two columns; the x and the y. Note that the y results will return continuous values.
To find the used dataset check the Random Linear Regression dataset on Kaggle. Below is a screenshot of the given dataset.
Example of a Linear Regression Model With Python
1. Import the necessary libraries
import numpy as np import pandas as pd import matplotlib.pyplot as plt import seaborn as sns from sklearn import linear_model from sklearn.model_selection import train_test_split import os2. Reading and Sampling our dataset
To simplify our dataset, we took a sample of 50 data rows and rounded the data values to 2 significant figures.
Note that you should import the given dataset before finalizing this step.
df = pd.read_csv("../input/random-linear-regression/train.csv") df=df.sample(50) df=round(df,2)3. Filtering the Null and Infinite values
If our dataset contains null and infinite values, unnecessary errors may arise. Therefore, we will use the clean_dataset function to clean our dataset of such values.
def clean_dataset(df): assert isinstance(df, pd.DataFrame), "df needs to be a pd.DataFrame" df.dropna(inplace=True) indices_to_keep = ~df.isin([np.nan, np.inf, -np.inf]).any(1) return df[indices_to_keep].astype(np.float64) df=clean_dataset(df)4. Choosing our dependent and independent values
Note that we converted our data into DataFrame format. The dataframe datatype is a 2-dimensional structure that aligns our data into rows and columns.
5. Splitting the dataset
We will divide our dataset into training and testing portions. We chose our testing dataset size to be 20 percent of the total dataset.
Note that by having the random_state=1, each time the model does run ,the same data split will occur ,resulting in the same exact training and testing datasets.
This can be useful in cases where you would like to tune your model further.
x_train, x_test, y_train, y_test = train_test_split(X, Y, test_size=0.2, random_state=1)6. Building Linear Regression Model
Using the imported linear regression model, we can freely use the linear regression algorithm in our model, bypassing the x and y training variables that we obtained for the given model.
lm=linear_model.LinearRegression() lm.fit(x_train,y_train)7. Plotting our data in a scattered manner
df.plot(kind="scatter", x="x", y="y")8. Plotting our linear regression line
plt.plot(X,lm.predict(X), color="red")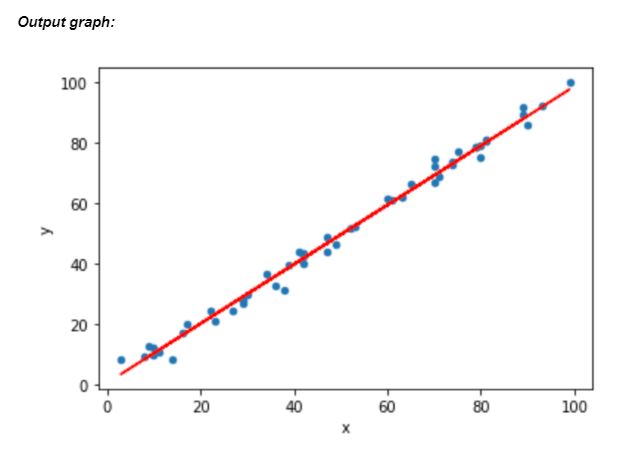
The blue dots indicate our data points, while the red line is the best fit linear regression line drawn by our model. The linear model algorithm will always try to draw the best fit line to predict the results as accurately as possible.
Logistic Regression
Similar to linear regression, logistic regression is used to predict an output value depending on a defined input variable, but the main difference between these two algorithms is that the output of the logistic regression algorithm should be a categorization(discrete) variable.
For our Python example, we will use logistic regression to classify given flowers into two different categories/species. Our given dataset will include multiple features of different flower species.
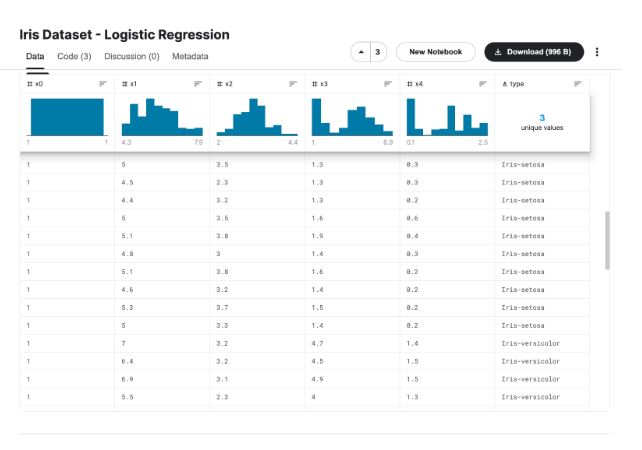
The main purpose of our model is to identify the given flower as either an Iris-setosa, Iris-versicolor, or an Iris-virginica.
To find the used dataset check the Iris Dataset — Logistic Regression on Kaggle. Below is a screenshot of the given dataset.
Example of a Logistic Regression Model With Python
1. Import the necessary libraries
import numpy as np import pandas as pd from sklearn.model_selection import train_test_split import warnings warnings.filterwarnings('ignore')2. Importing our dataset
data = pd.read_csv('../input/iris-dataset-logistic-regression/iris.csv')3. Choosing our dependent and independent values
For our independent value(x) ,we will include all available columns except the type columns. As for our dependable value(y), we will only include the type column.
X = data[['x0','x1','x2','x3','x4']] y = data[['type']]4. Splitting our dataset
We will split our dataset into two portions, 80 percent for the training dataset and 20 percent for the testing dataset.
X_train,X_test,y_train,y_test = train_test_split(X,y, test_size=0.2, random_state=1)5. Running our logistic regression model
We will import the whole logistic regression algorithm from the linear_model library. We can then fit our X and y training data into the logistic model.
from sklearn.linear_model import LogisticRegression model = LogisticRegression(random_state = 0) model.fit(X_train, y_train)6. Evaluating our model's performance
print(lm.score(x_test, y_test))The returned value is 0.9845128775509371, which indicates the high performance of our model.
Note that as the testing score increase ,so does the model's performance.
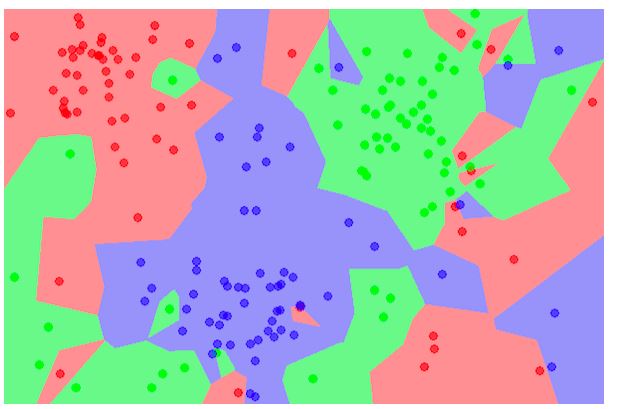
7. Plotting our graph
import matplotlib.pyplot as plt %matplotlib inline plt.plot(range(len(X_test)), pred,'o',c='r')Output graph:
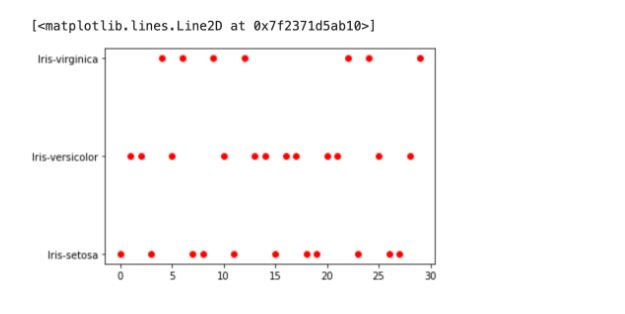
In the logistic graph, the red dots indicate our given data points. The points are clearly divided into 3 categories, virginica, versicolor, and setosa flower species.
Using this technique, the logistic regression model can easily categorize the flower type depending on its location on the graph.
Support Vector Machines
The support vector machines (SVM) algorithm is another well-known supervised machine learning model created by Vladimir Vapnik that is capable of both classification and regression problems. Although, it is more commonly used for classification problems rather than regression.
The SVM algorithm is capable of splitting the given data points into different groups. This is done by having our algorithm plot the data and then drawing the most suitable line to split the data into multiple categories.
As you can see in the below figure, the drawn line perfectly splits the dataset into 2 different groups, blue and green.
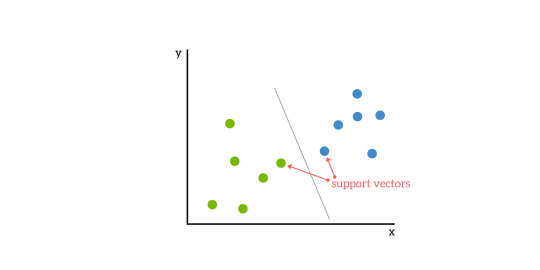
The SVM model can draw lines or hyperplanes depending on the dimensions of the plotted graph. Lines can only work with 2-dimensional datasets meaning datasets with only 2 columns.
As multiple features may be used to predict the given dataset, higher dimensions will be necessary. In cases where our data set will result in more than 2 dimensions, the Support Vector Machine model will draw a more fitting hyperplane.
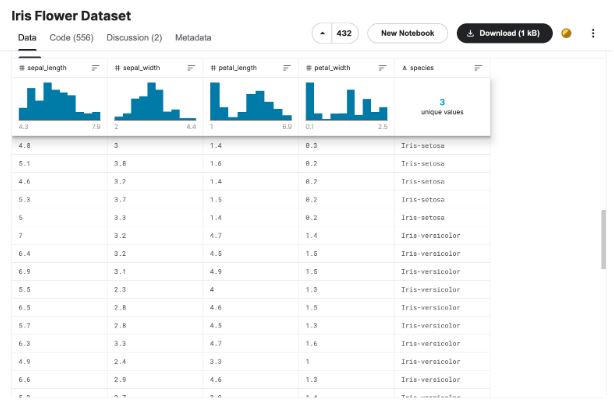
For our Support Vector Machine Python example, we will do a species classification for 3 different flower types. Our independent variable will include all the given features of a certain flower, while our dependent variable will be the specified species that the flower does belong to.
Our flower species include Iris-setosa, Iris-versicolor, and Iris-virginica.
To find the used dataset check the Iris Flower Dataset on Kaggle. Below is a screenshot of the given dataset.
Example of a Support Vector Machine Model With Python
1. Import the necessary libraries
import numpy as np import pandas as pd from sklearn.model_selection import train_test_split from sklearn.datasets import load_iris2. Reading the given dataset
Note that you should import the given dataset before going through with this step.
data = pd.read_csv(‘../input/iris-flower-dataset/IRIS.csv’)3. Split the data columns into dependent and independent variables
We will have our X value as the independent variable with it containing all columns except the species column.
For our dependent value, the y variable will contain only the species column ,which our model should predict.
X = data.drop(‘species’, axis=1) y = data[‘species’]4. Split the dataset into training and testing datasets
We divided our dataset into 2 portions, in which we located 80 percent of our data into our training dataset and 20 percent into the testing dataset.
X_train, X_test, y_train, y_test = train_test_split(X, y, test_size=0.2, random_state=1)5. Import the SVM and run the model
We imported the Support Vector Machine algorithm as a whole. We then ran it using the X and y training datasets we received from previous steps.
from sklearn.svm import SVC model = SVC( ) model.fit(X_train, y_train)6. Testing our model's performance
model.score(X_test, y_test)To evaluate our model's performance we will use the score function. In which we will feed our X and y testing values that we already created in our fourth step into the score method.
The returned value is 0.9666666666667, which indicates the high performance of our model.
Note that as the testing score increase ,so does the model's performance.
Other Popular Supervised Machine Learning Algorithms
While the linear, logistic, and SVM algorithms are quite reliable, we will also mention some honorable supervised machine learning algorithms that exists out there.
1. Decision Trees
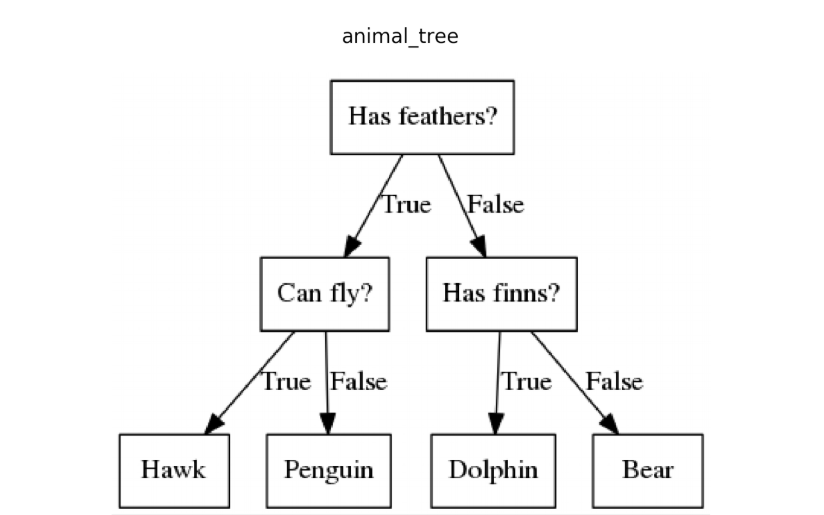
Decision tree algorithm is a supervised machine learning model that utilizes tree-like structures for decision making. Decision trees are usually used for classification problems in which the model can decide the group to which a given item in a dataset belongs.
Note that the used tree format is that of an inverted tree.
2. Random Forest
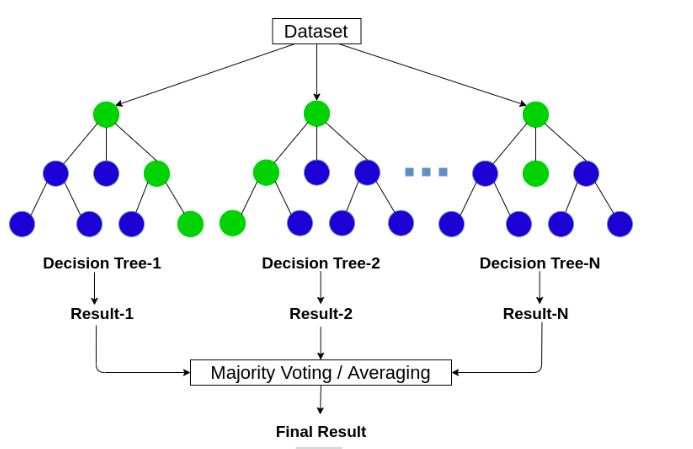
Considered a more complicated algorithm, the Random forest algorithm operates by constructing a multitude of decision trees to reach its final goal.
Meaning that multiple decision trees are built simultaneously, each returning its own result, which is then combined for a better result.
For classification problems, the random forest model would generate multiple decision trees and would classify a given object depending on the classification group predicted by most of the trees.
This wa,y the model can fix any overfitting caused by a single tree. Random forest algorithms can also be used for regression, although they may result in poor outcomes.
3. k-nearest neighbors
The k-nearest neighbor (KNN) algorithm is a supervised machine learning method that groups all given data into separate groups.
This grouping is based on shared common features between different individuals. The KNN algorithm can be used for both classification and regression problems.
An example of a KNN problem would be the classification of animal images into different groupsets.
To review what we learned in this article, we started by defining supervised machine learning and the two types of problems that it can solve.
Moving on we explained classification and regression problems and gave some examples of output data types for each.
Then we explained what a linear regression is and how it works and provided a concrete example in Python which tries to predict the Y value depending on the independent X variables.
We also explained a similar model to the linear regression one, which is the logistic regression model. We stated what is logistic regression and gave a classification model example that classifies the given images into a given flower species.
For our last algorithm, we had the Support Vector Machine algorithm, which we also used to predict the given flower species of 3 different flower species.
To end our article, we briefly explained other well-known supervised machine learning algorithms, such as Decision trees, Random Forests, and the K-nearest neighbor algorithms.
Whether you’re reading this article for school, work, or fun, we think that starting with these primary algorithms may be a good way to start your new machine learning passion.
If you are interested and would like to know more about the machine learning wo,rld we would recommend learning more about how such algorithms work and how you can tune such models to improve their performance even further. Don't forget that there are tons of other supervised algorithms out there for you to learn more about.
Published at DZone with permission of Kevin Vu. See the original article here.
Opinions expressed by DZone contributors are their own.
Comments